The 16th Annual Tree Report Card The State of DC's Trees
Welcome
Casey Trees’ mission is to restore, enhance, and protect the tree canopy of our nation’s capital. We pursue
that mission through tree planting, education, community action and land preservation. To guide our efforts
and those of our partners, each year we publish a Tree Report Card (TRC) that measures progress toward
achieving the District’s 40% tree canopy goal, and the extent and condition of DC’s trees.
Note from the Executive Director
Note from the Executive Director
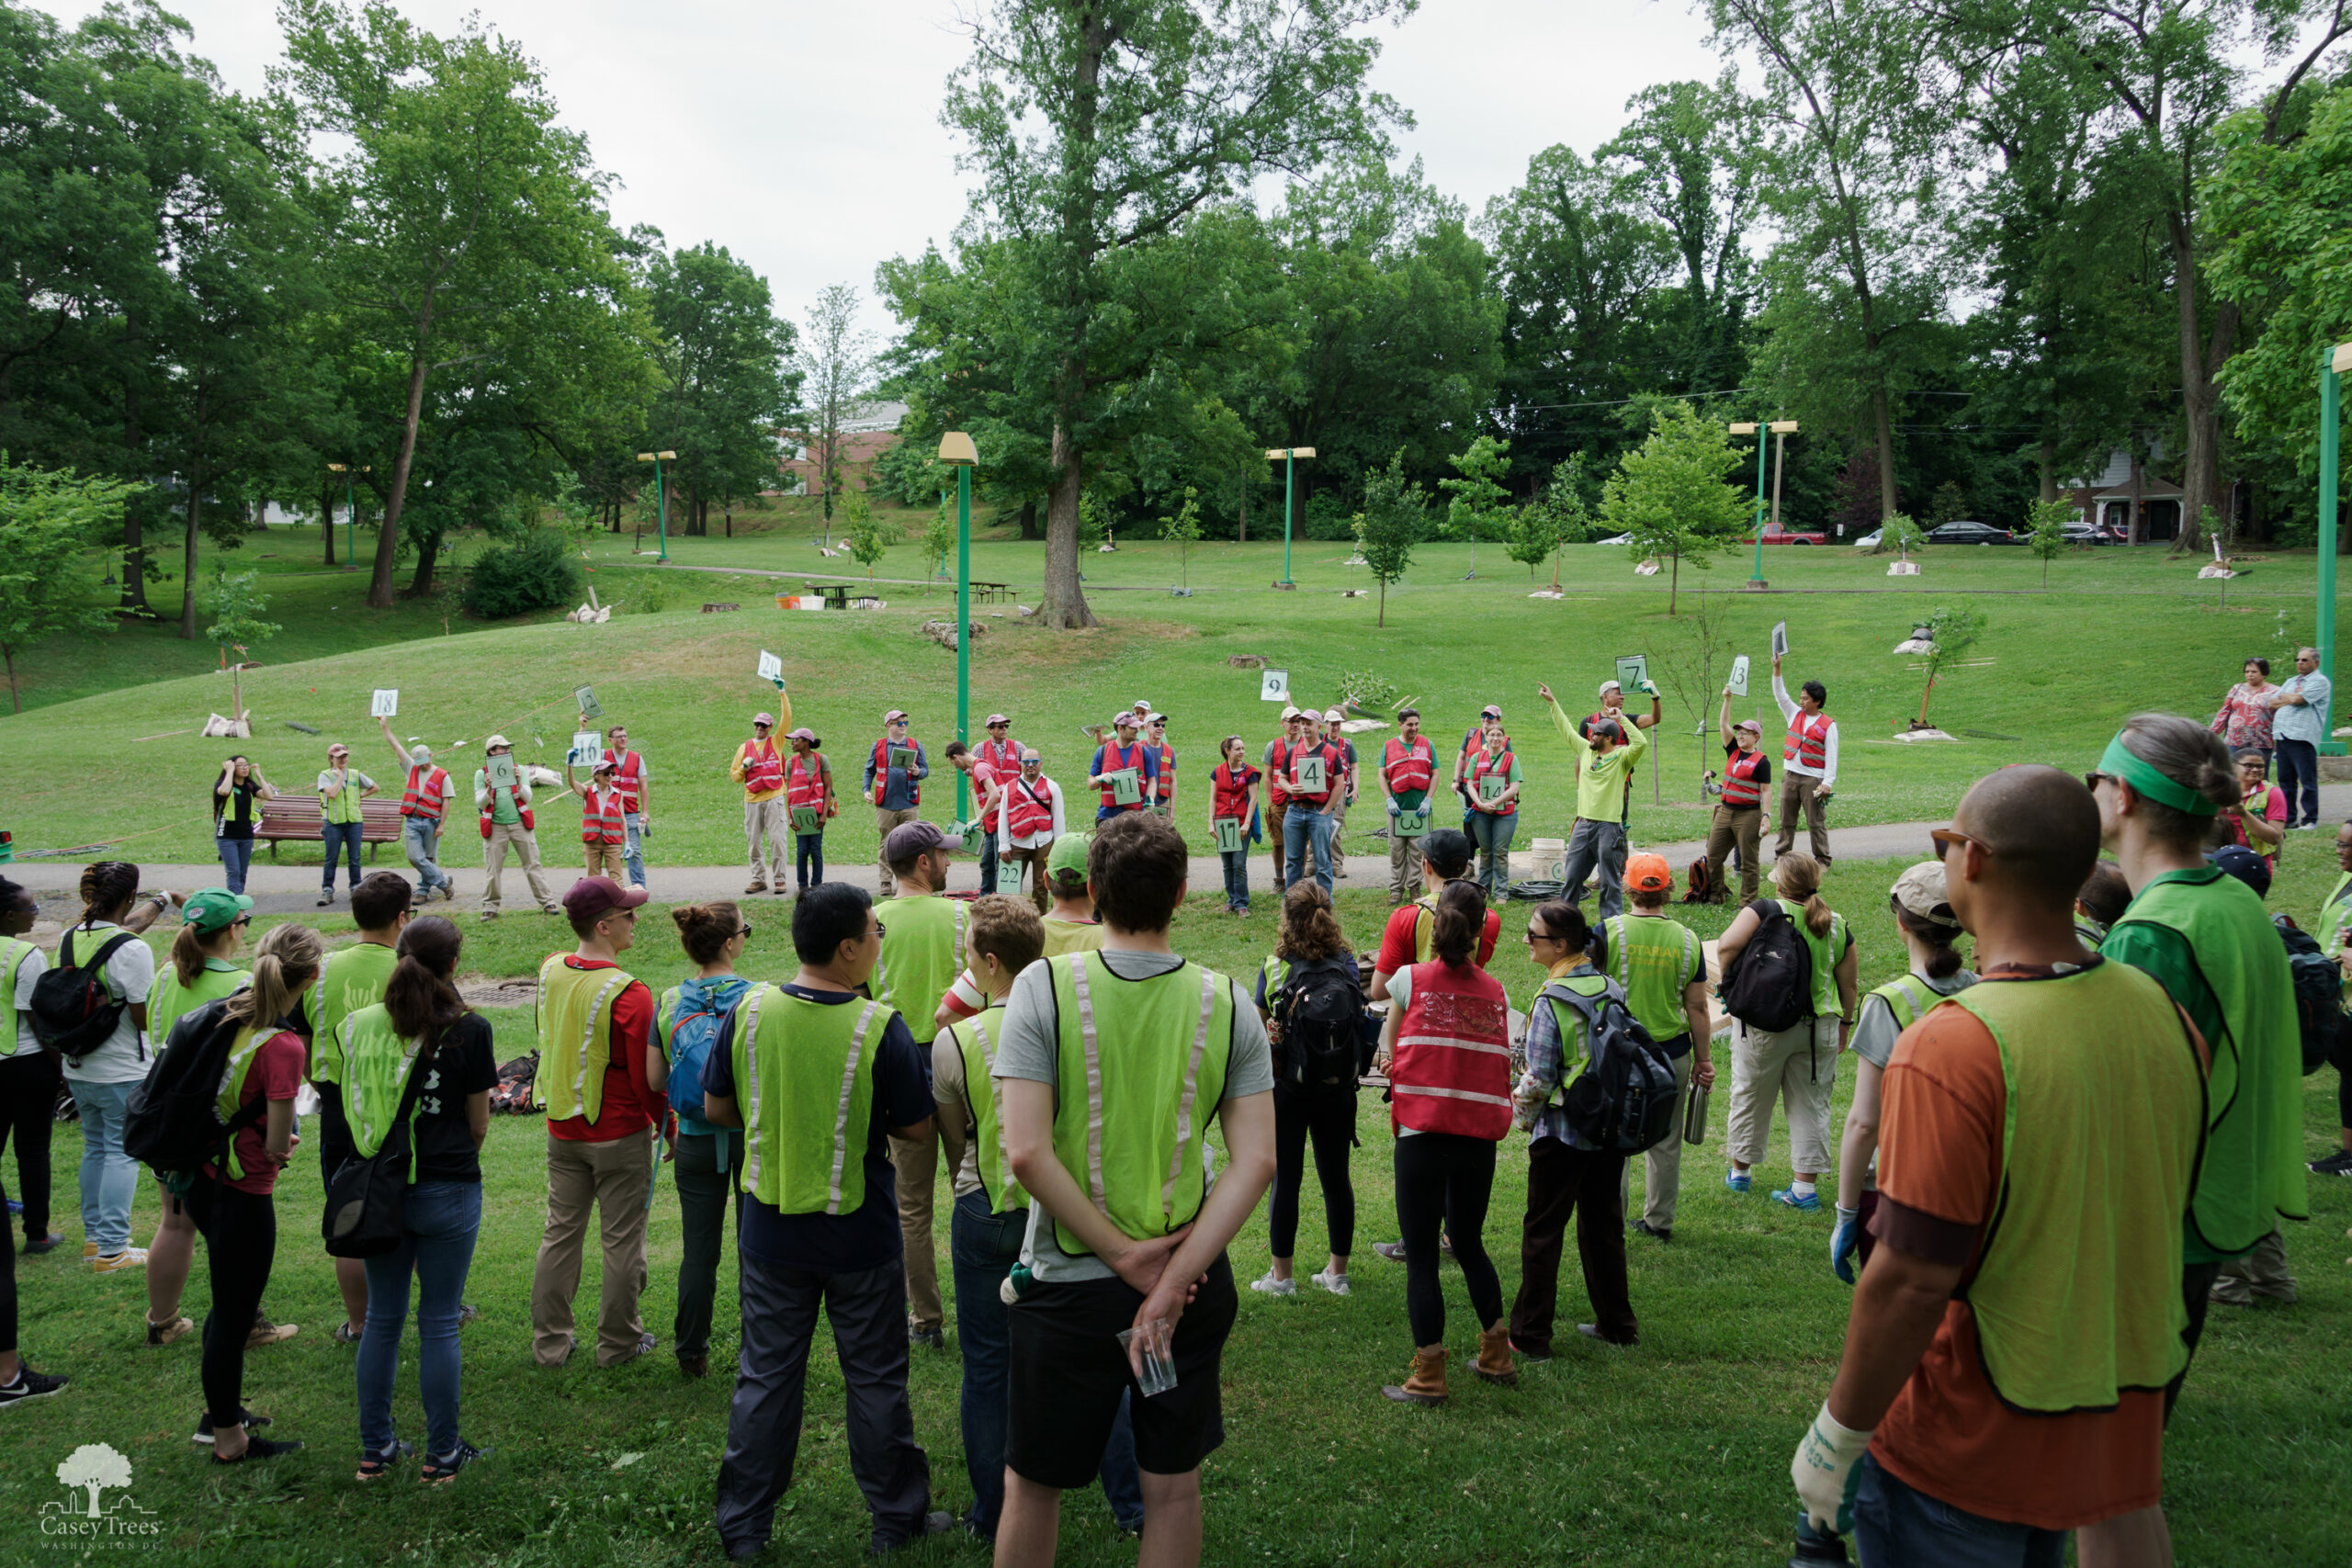
I think most would agree that teaching youngsters about the importance of trees and greenspace is
critical to the sustainability – and livability – of our cities and towns. Knowledge gained from
environmental education and outdoor experiences often transforms into productive civic engagement.
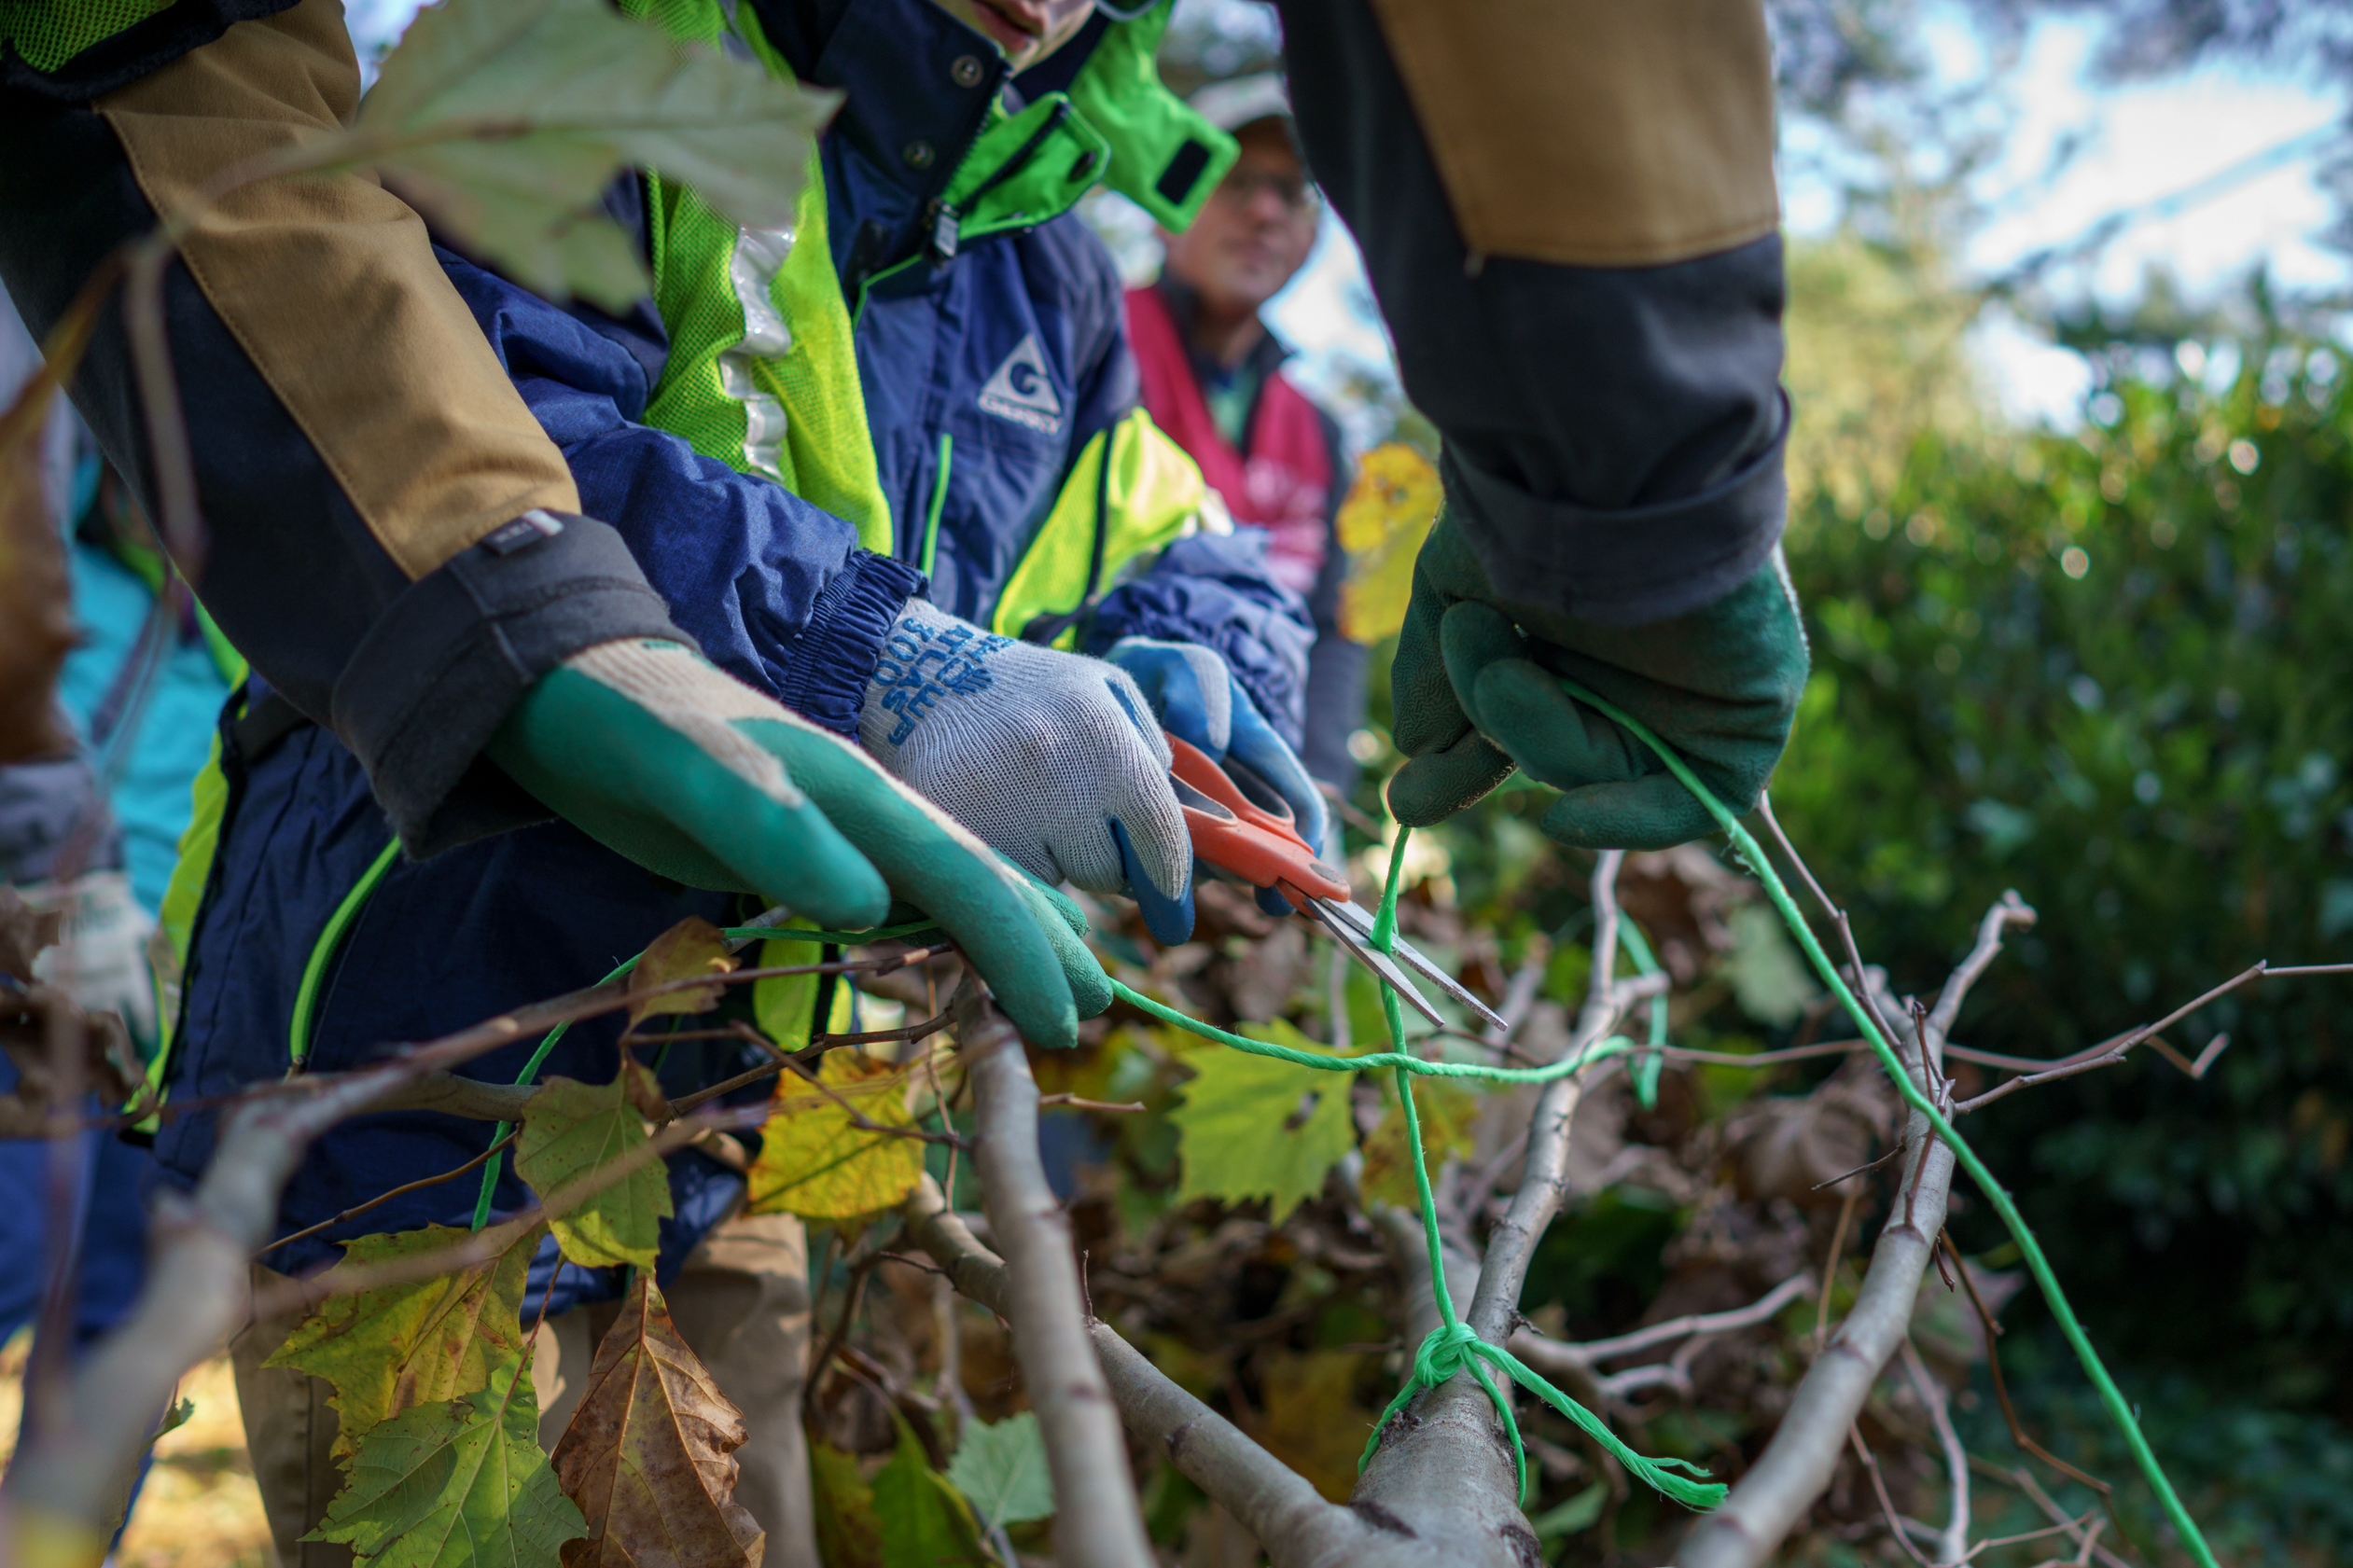
At Casey Trees we see this concept in action every time someone plants a tree, saves a tree by
removing damaging vines, or advocates for stronger tree protections before the Washington, DC City
Council.
Every year Casey Trees’ staff teaches thousands of students about the importance of trees and urban
forestry. Alongside the curriculum, our team harvests trees at our tree nursery in Berryville, VA
and works with the same students to plant hundreds of trees within their schoolyards. This “teaching
and doing” approach is incredibly powerful and highlights the fact that urban schoolyards can and
should be – green schoolyards.
This year’s Tree Report Card takes a more in-depth look at DC’s schools, how their tree canopies
stack up, and what could be done to make them better. When students are exposed to trees where they
spend a large part of their day, they not only internalize the benefits that trees and greenspace
offer – they also pass those lessons along to others, perpetuating the cycle of learning, growing,
and giving back to the community.
Mark Buscaino, Executive Director
Spotlight: School Tree Canopy
Spotlight: School Tree Canopy
For our 2023 Tree Report Card we compiled canopy data from every DC school – public, charter and private. We
found that school tree canopy averages 13%, far below the overall DC average
of 37%. We also found that canopy varies wildly from school to school, and by school type. While school
campuses understandably have outdoor space needs that compete for trees and greenspace, as the charts below
illustrate, the canopy percentages we found are extremely low.
School Type and Average Canopy
School Grade Level
Average Canopy
Elementary Schools
12.3%
Middle Schools
11.7%
High Schools
11.7%
Others*
17.7%
All Schools
13.0%
School Type
Average Canopy
Private
23.5%
Charter Schools
11.1%
Public Schools
10.1%
All Schools
13.0%
*includes shared campuses, pre-k schools, and adult
programs.
These numbers are sobering because simply put, a tree-filled schoolyard makes sense. A healthy tree canopy
keeps impervious play areas cooler, filters particulates and most surprisingly – views of green have been
shown to reduce anxiety and improve test scores. While many DC schools do not have sufficient land area to
achieve 40% canopy, our analysis shows that most could still significantly increase
their canopy coverage and potentially double it – or more. The following summary shows average
tree coverage amongst all schools by Ward, the canopy they could have if all available space (excludes play
areas, etc.) were planted, and – canopy trends from 2015 - 2020.
DC Schools Tree Canopy Data (Averages among all schools by Ward)
Ward
Existing Canopy
Potential Canopy
Canopy Change 2015-2020
1
7.8%
15.9%
+0.5%
2
4.7%
18.5%
-1.5%
3
16.5%
39.7%
-0.3%
4
8.9%
25.1%
+0.8%
5
12.5%
32.8%
-1.6%
6
5.1%
21.9%
-2.5%
7
12.8%
41.5%
-2.2%
8
14.1%
32.9%
-0.8%
Data Conclusions
There are three main takeaways to this data. First, school canopies are not spread equally across the city,
geographically or by school types. Where families live and the schools they have
access to therefore directly impacts their ability to reap the benefits we see from having nature near
our schools. Second, except for Wards 1 and 4, canopy in all schools is declining – Wards 3 and 8
have the highest average canopy at 16.5% and 14.1% respectively, while the more densely built Wards 1 and 6
have the lowest at 7.8% and 5.1%. Finally, there’s plenty of room for improvement. For example, while things
appear challenging for Wards 1 and 6 schools, with some planting Ward 1 schools could double their tree
canopy and Ward 6 schools could quadruple theirs.
In short, the tree canopy shading DC’s schools is extremely low – significantly lagging the city overall.
Further, as the existing and potential canopy figures show, there is no real good reason for this, and with
sufficient focus, canopy cover for all schools city-wide could increase. As our Tree
Report Card has recommended now for the past two years, establishing school canopy goals and encouraging
tree planting could significantly improve school environments for both students and staff.
Below we’ve showcased three schools to highlight the unique challenges and opportunities schools face in
trying to increase their tree canopy, and enhance environmental education throughout DC.
Case Studies
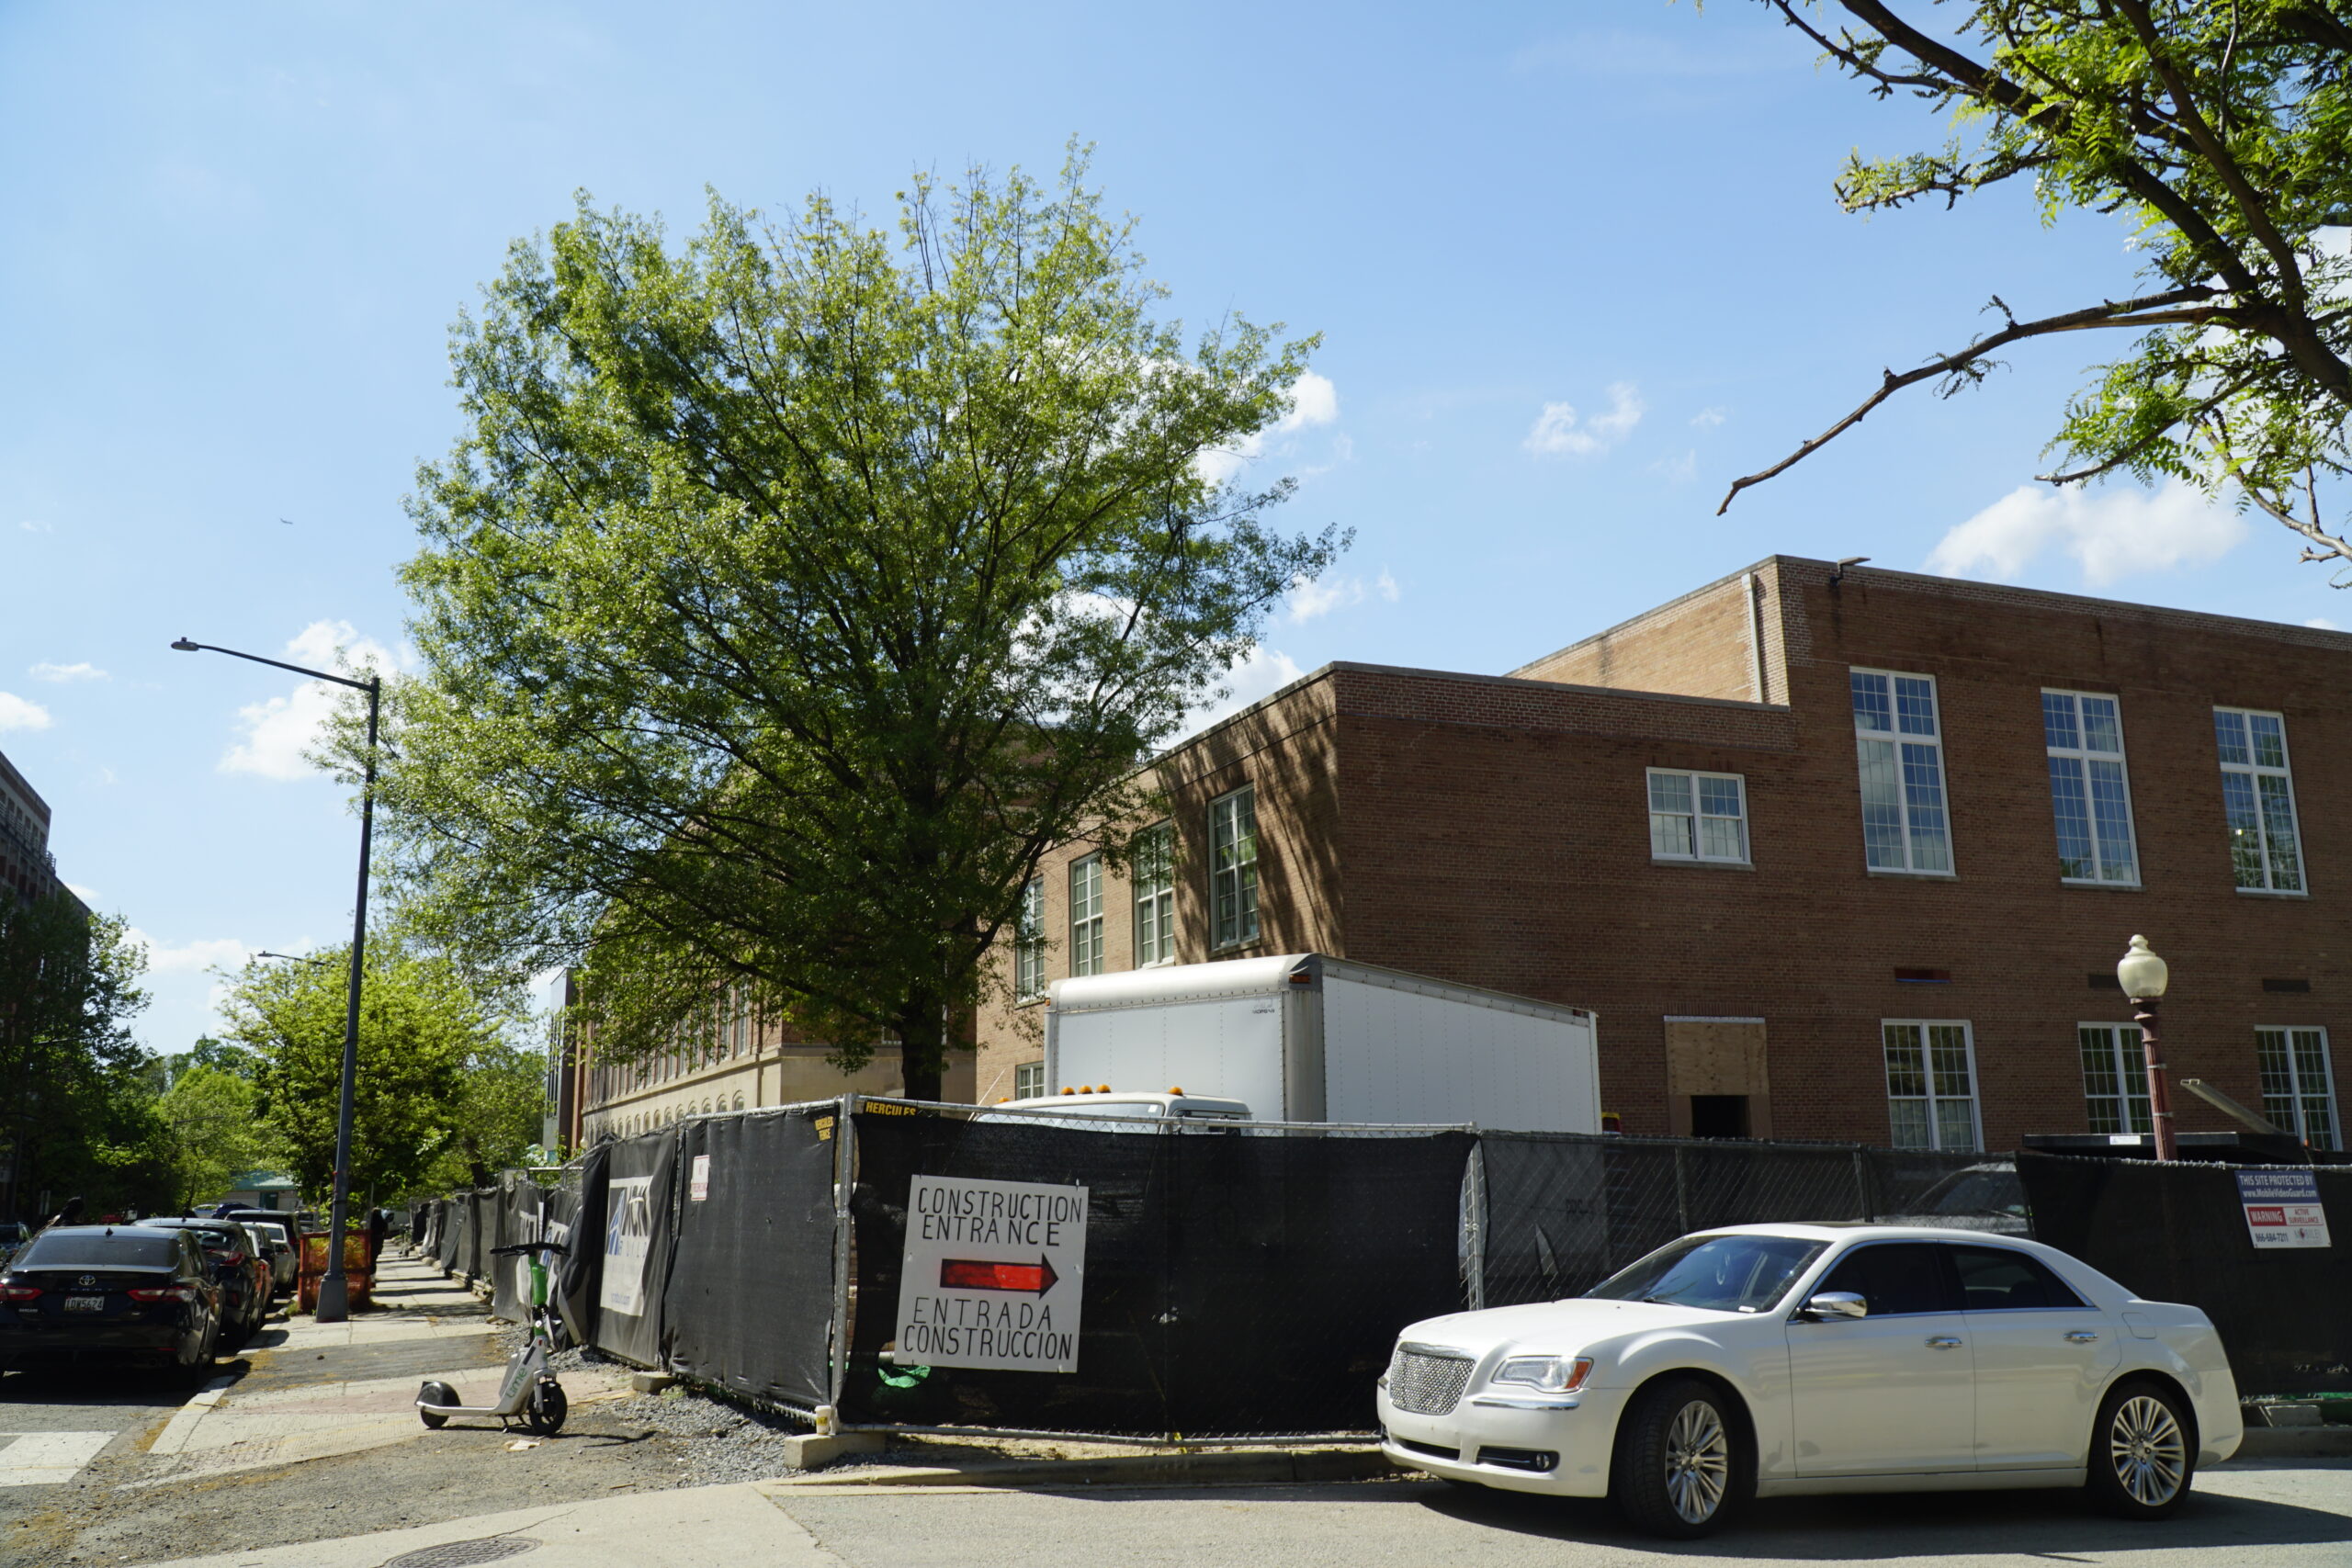
School Redevelopment
School Without Walls at Francis Stevens
Ward 4
Current Canopy Cover: 11.4%
Potential Canopy Cover: 14.8%
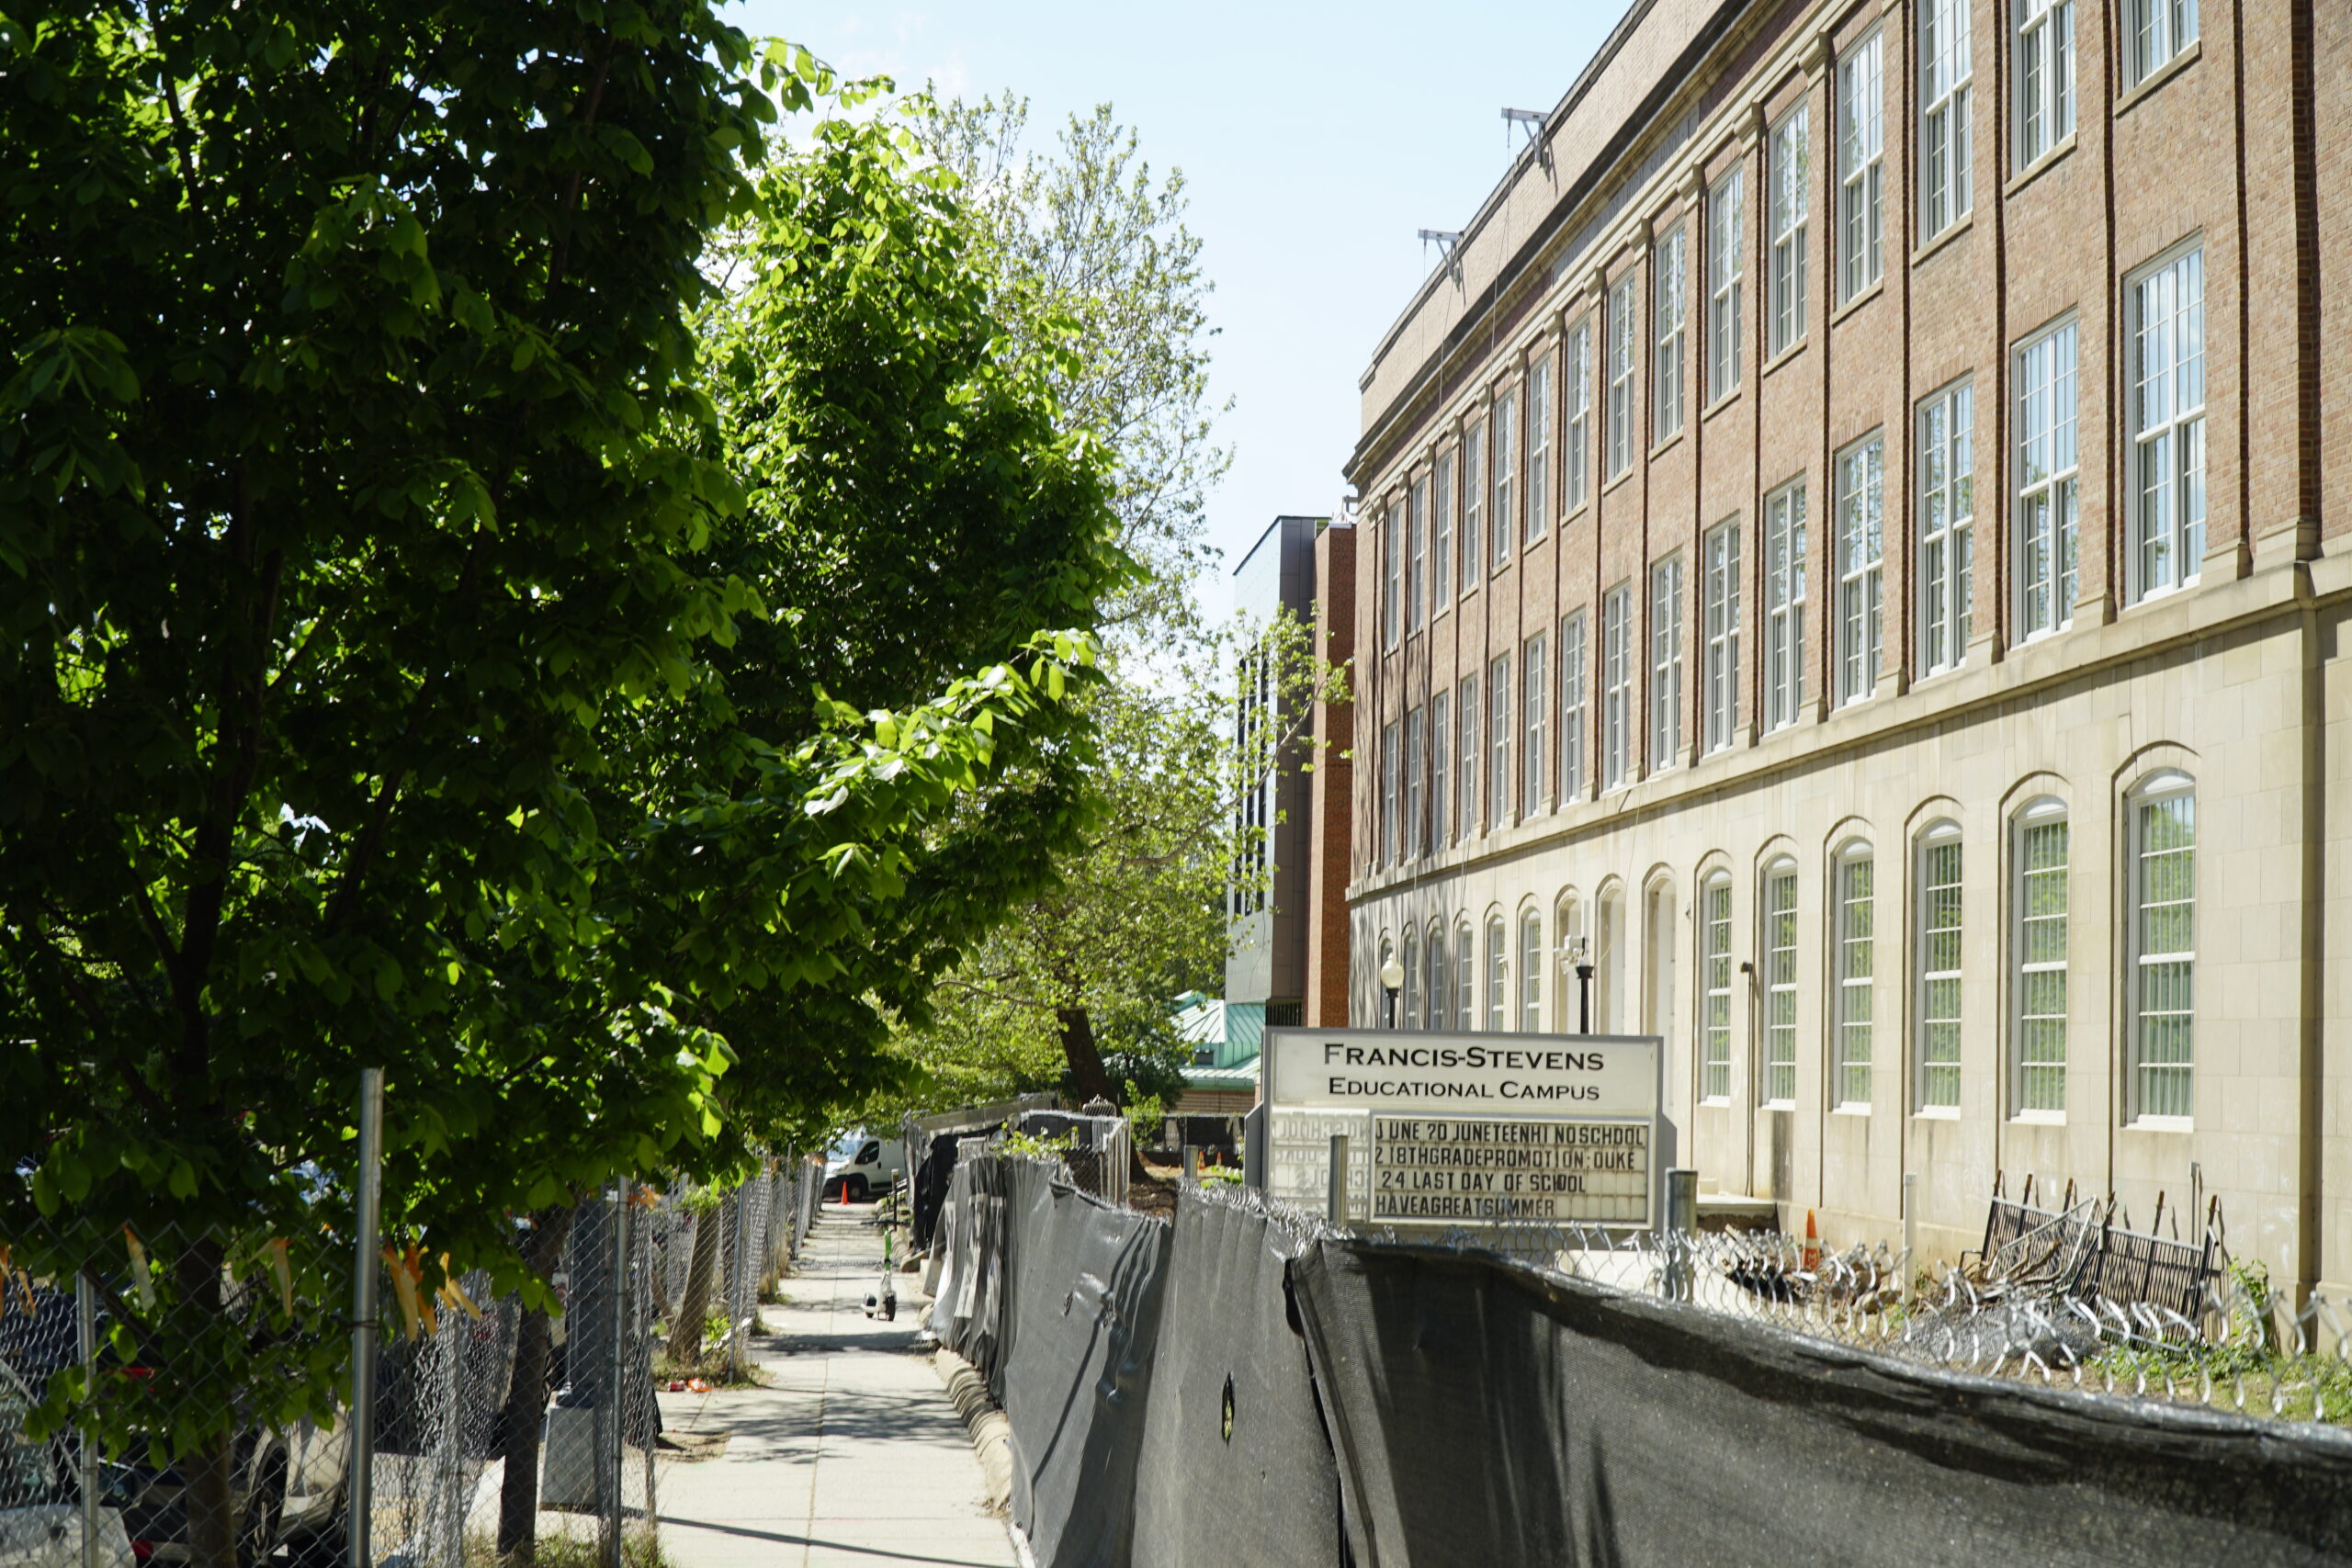
School Without Walls at Francis Stevens is located in the West End neighborhood of Ward 2, directly
abutting Rock Creek Park. There is a walking trail connecting Rock Creek Park to the school's campus and
canopy overlap between the Park and campus, providing accessible greenspace to the community and
students. Currently, School Without Walls operates from a satellite location at the Banneker campus in
Ward 1 while renovations are underway.
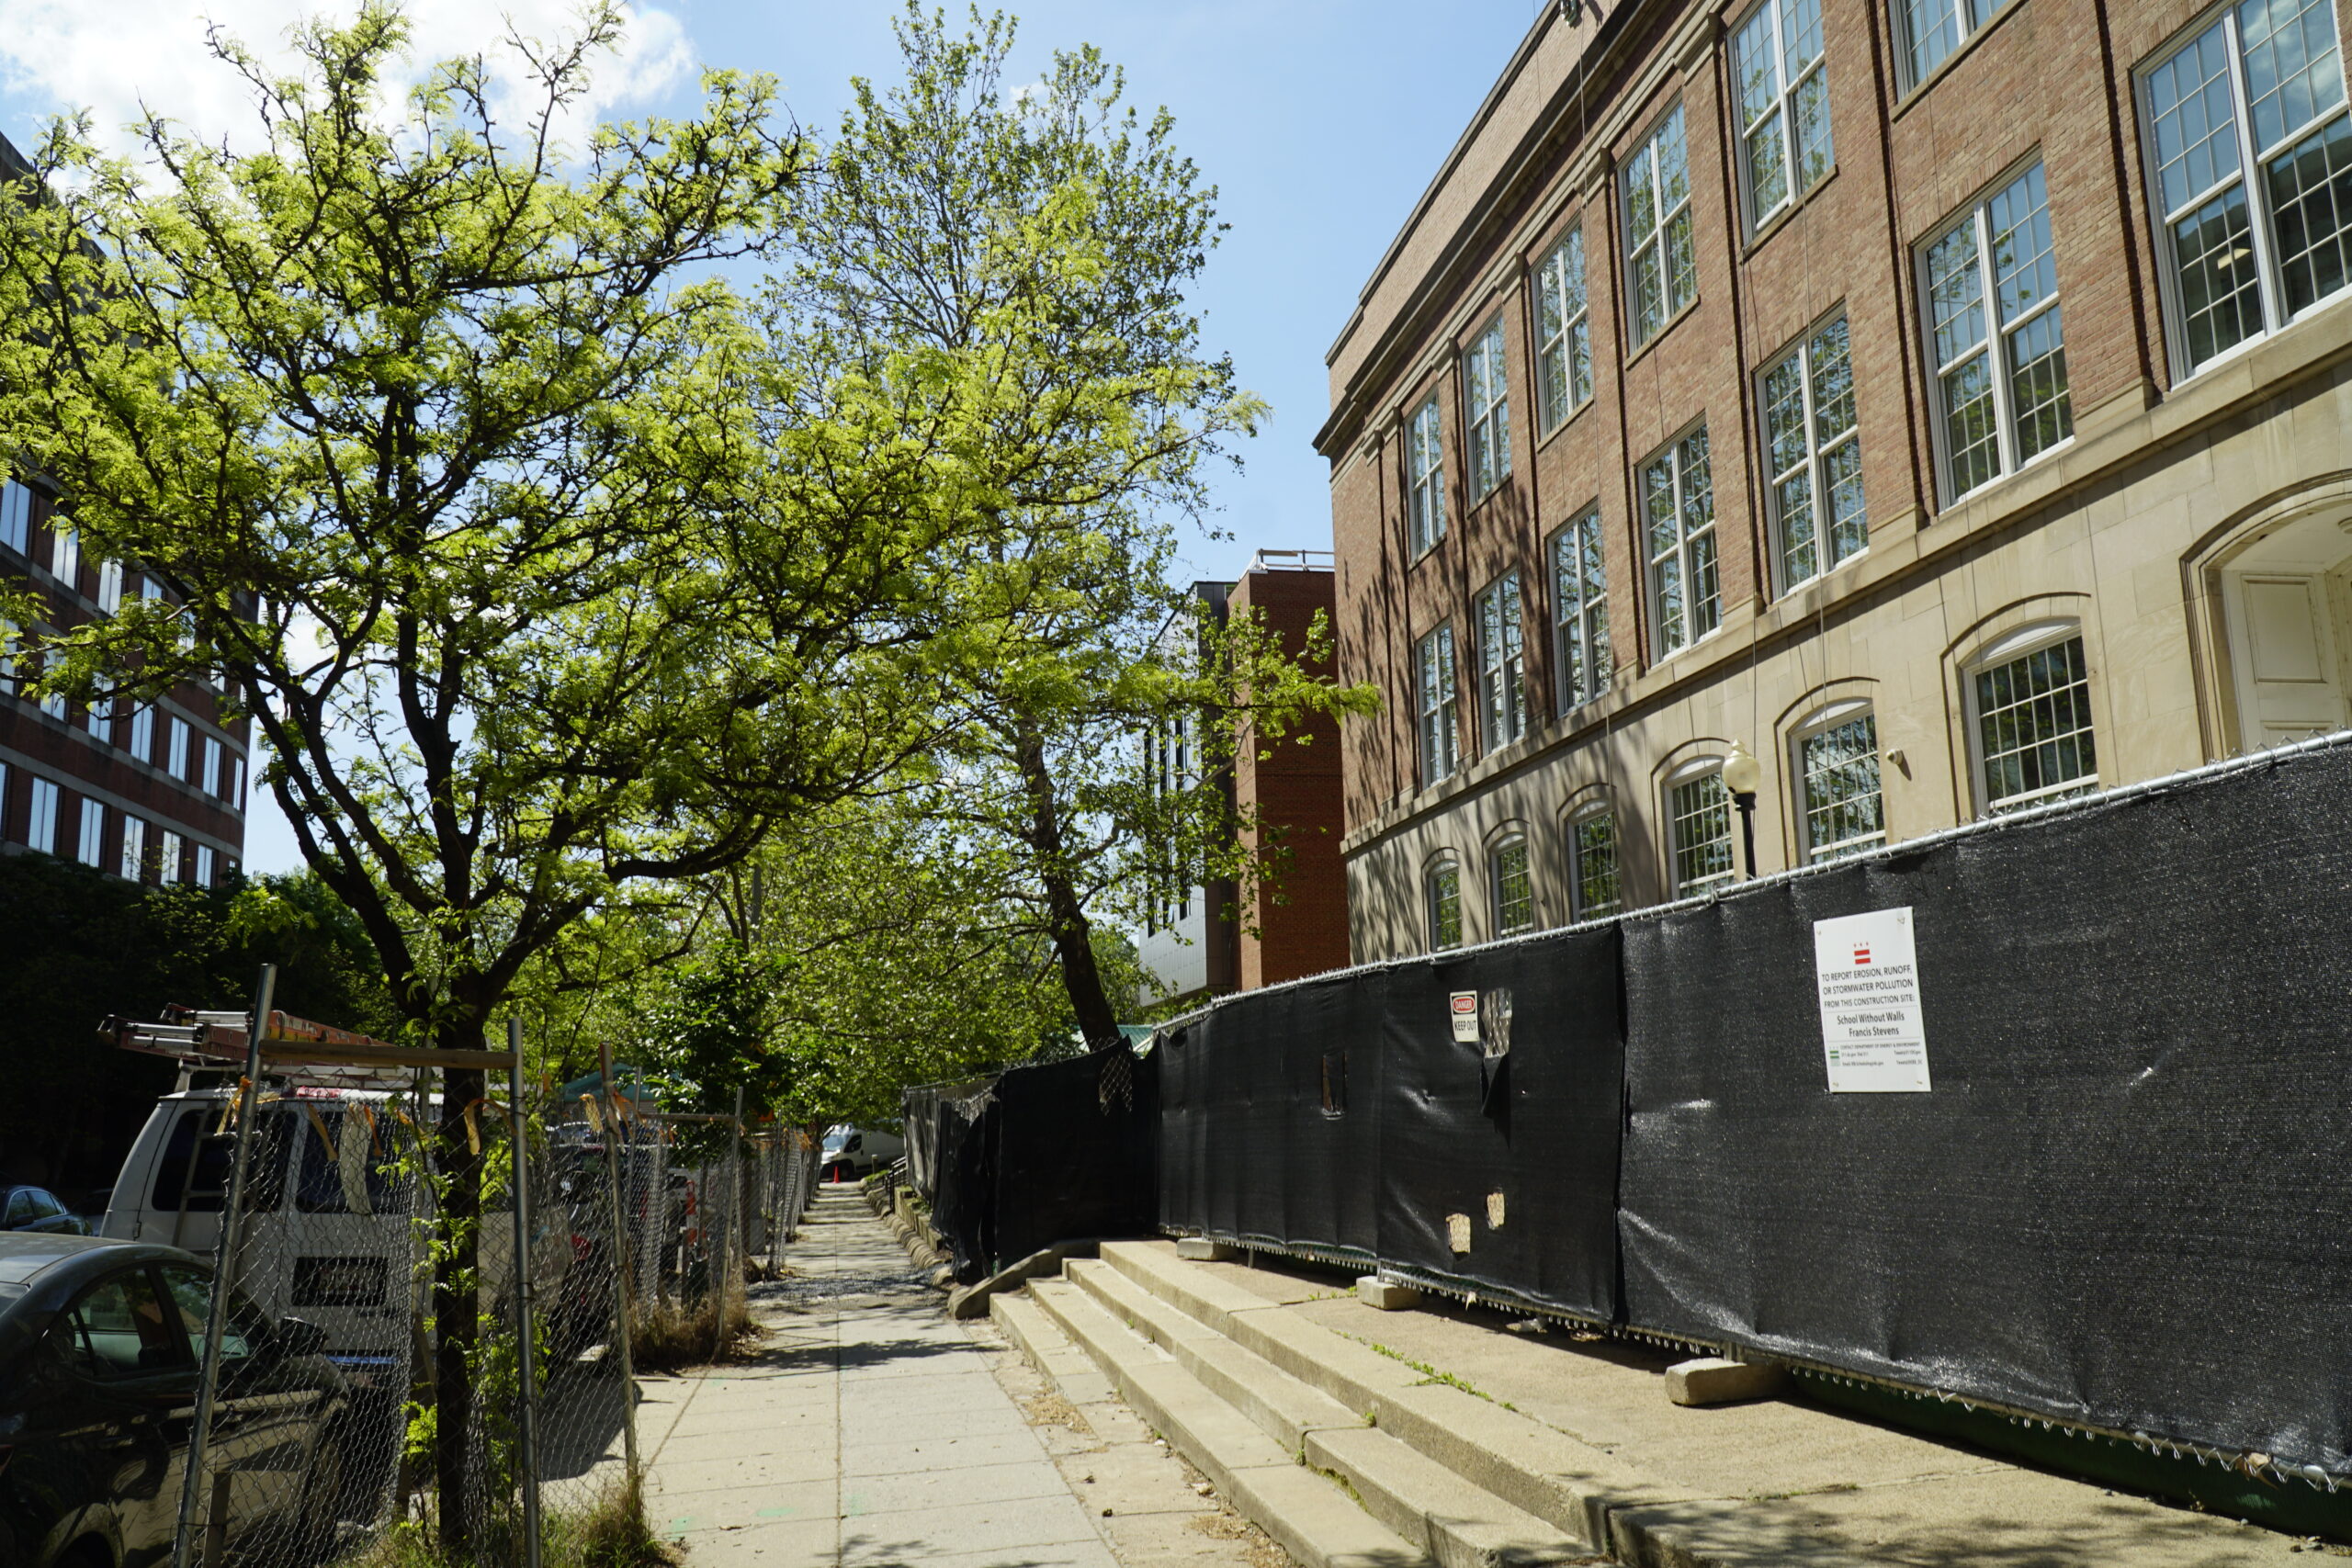
School Without Walls demonstrates a pressing challenge similar to other schools that are undergoing
redevelopment are grappling with – the difference between the existing and potential canopy coverage is
small, and renovations often require tree removal to meet architectural and related requirements. For
example, some of the trees planted by Casey Trees in 2016-18 will be lost. This could include up to 10
trees, and some of the river birch, blackgum, and other shade trees that have been growing tall now for
close to a decade. On the plus side, several existing larger trees will be saved and will be included as
part of an outdoor classroom space. We are glad to see that outdoor education is being incorporated into
these plans, and that this space will provide more educational opportunities for the students at School
Without Walls.
Riversmart Schools
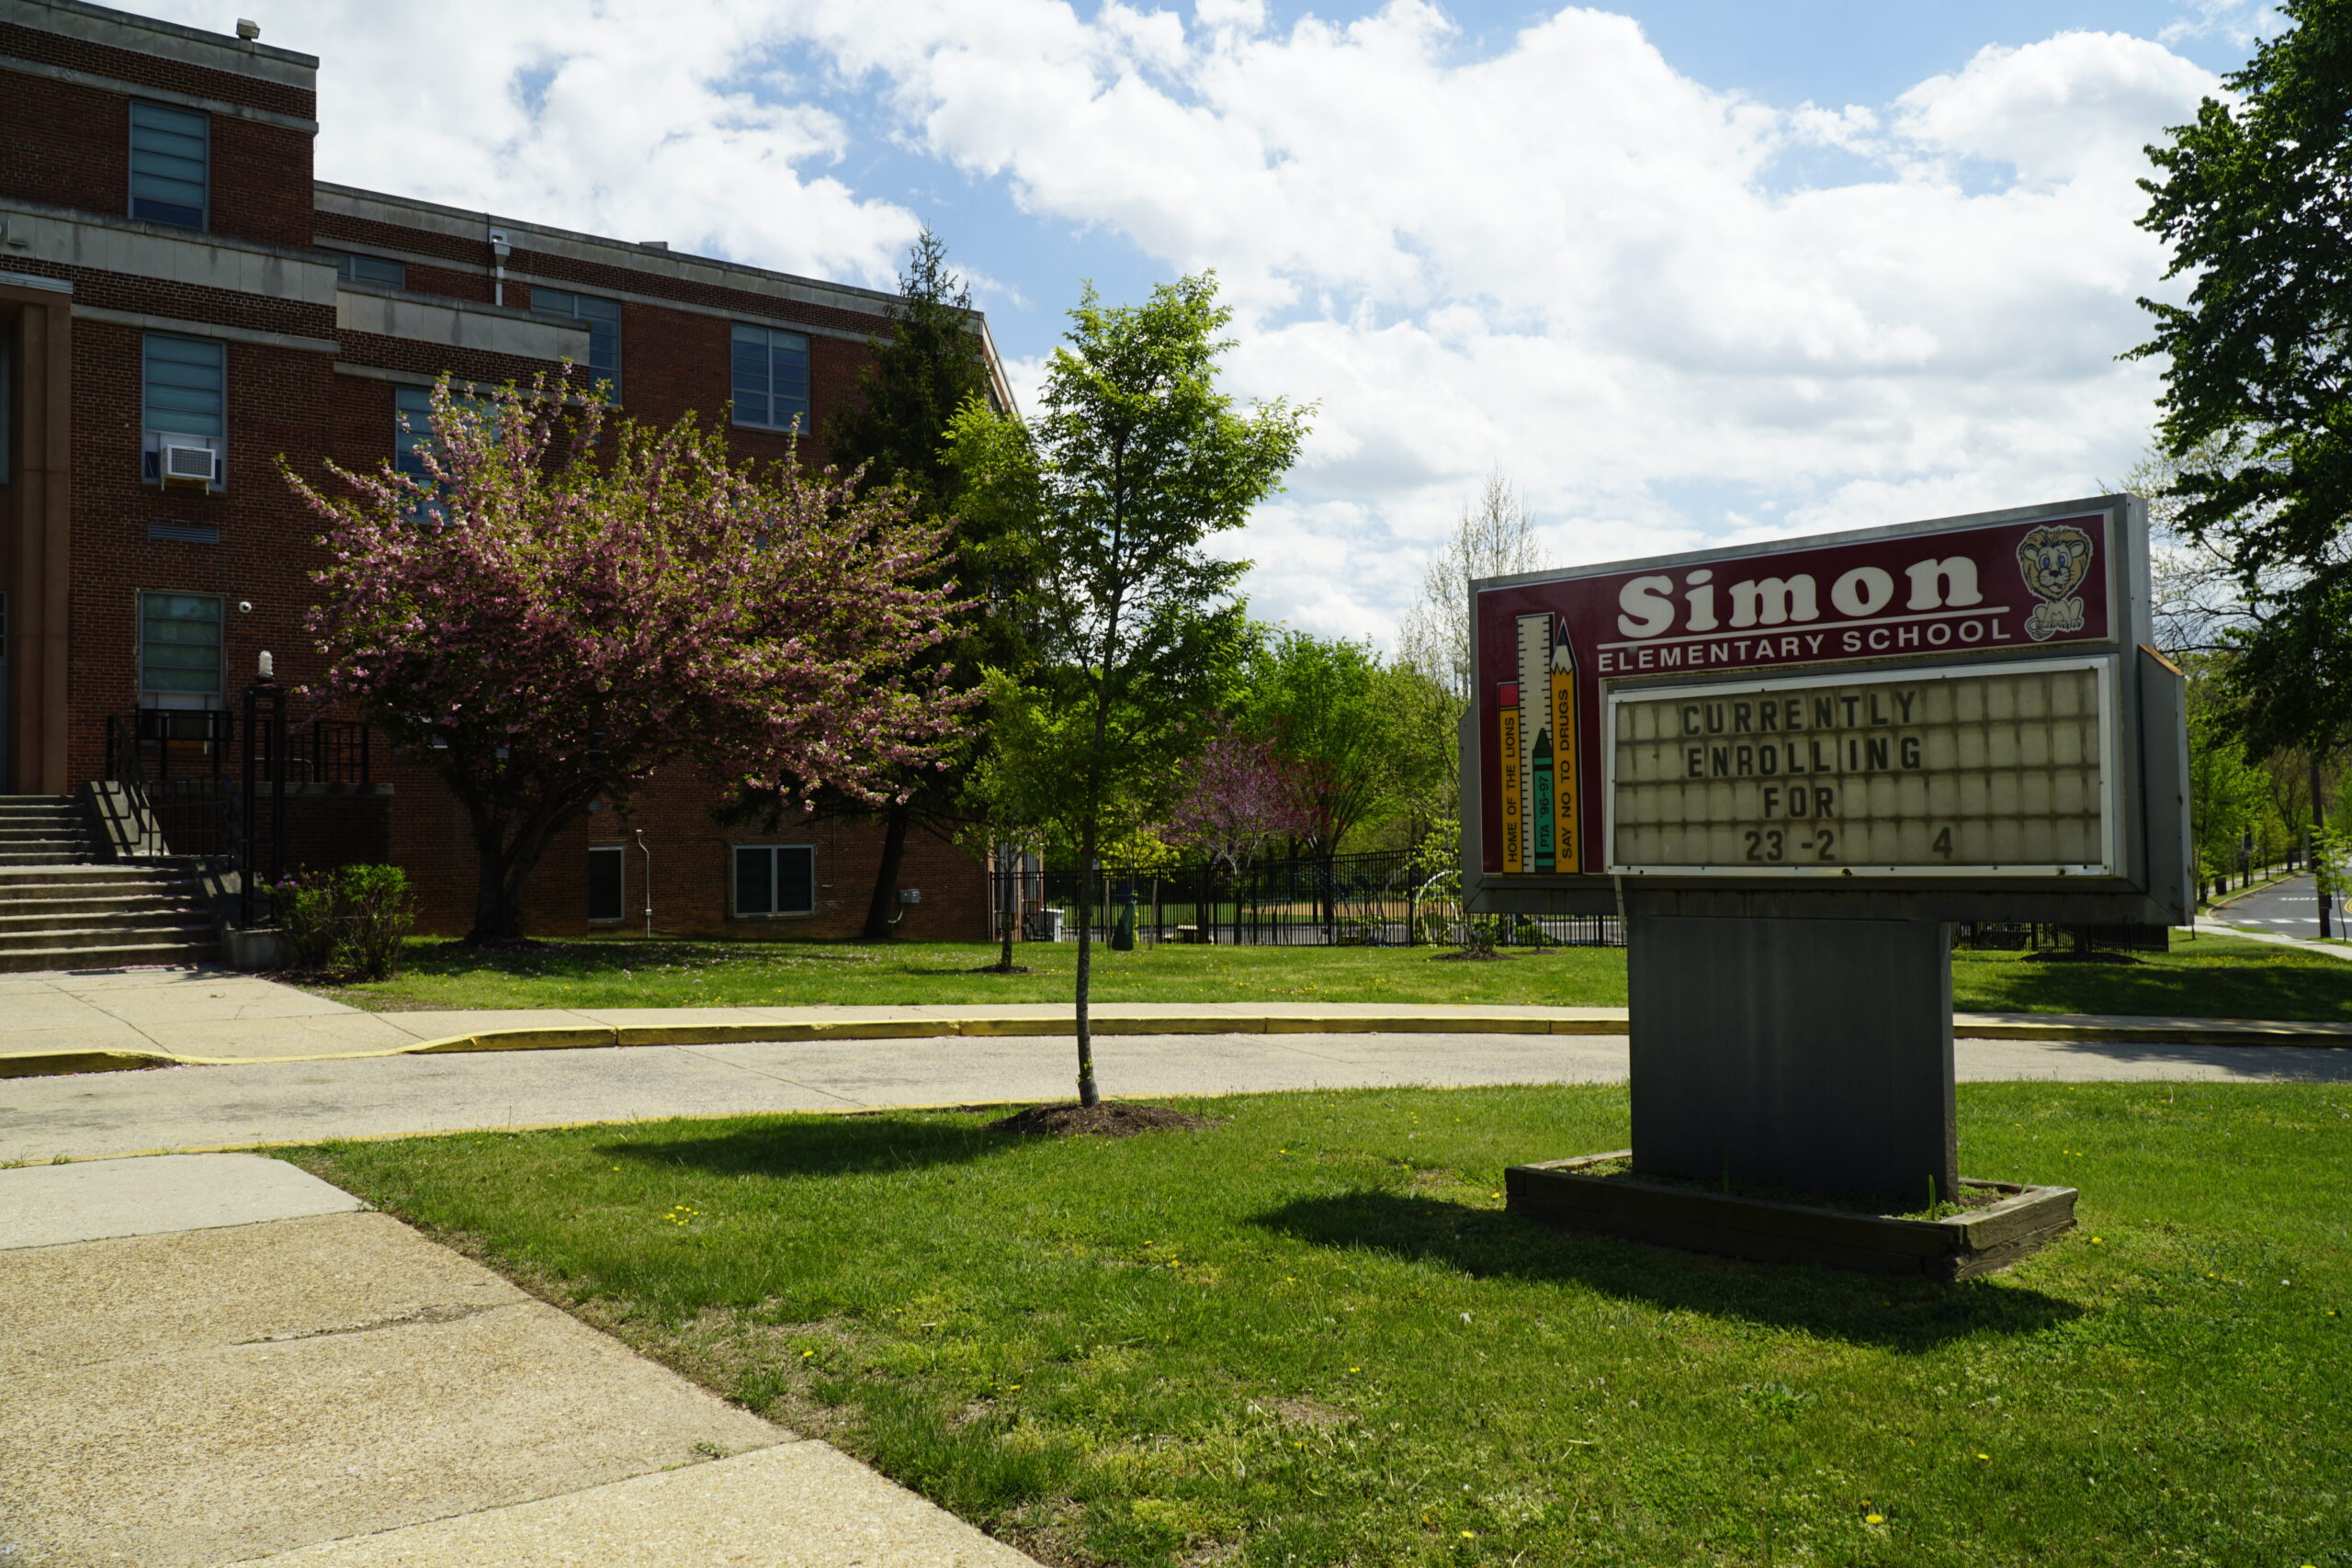
Simon Elementary School
Ward 8
Current Canopy Cover: 22.1%
Potential Canopy Cover: 43.4%
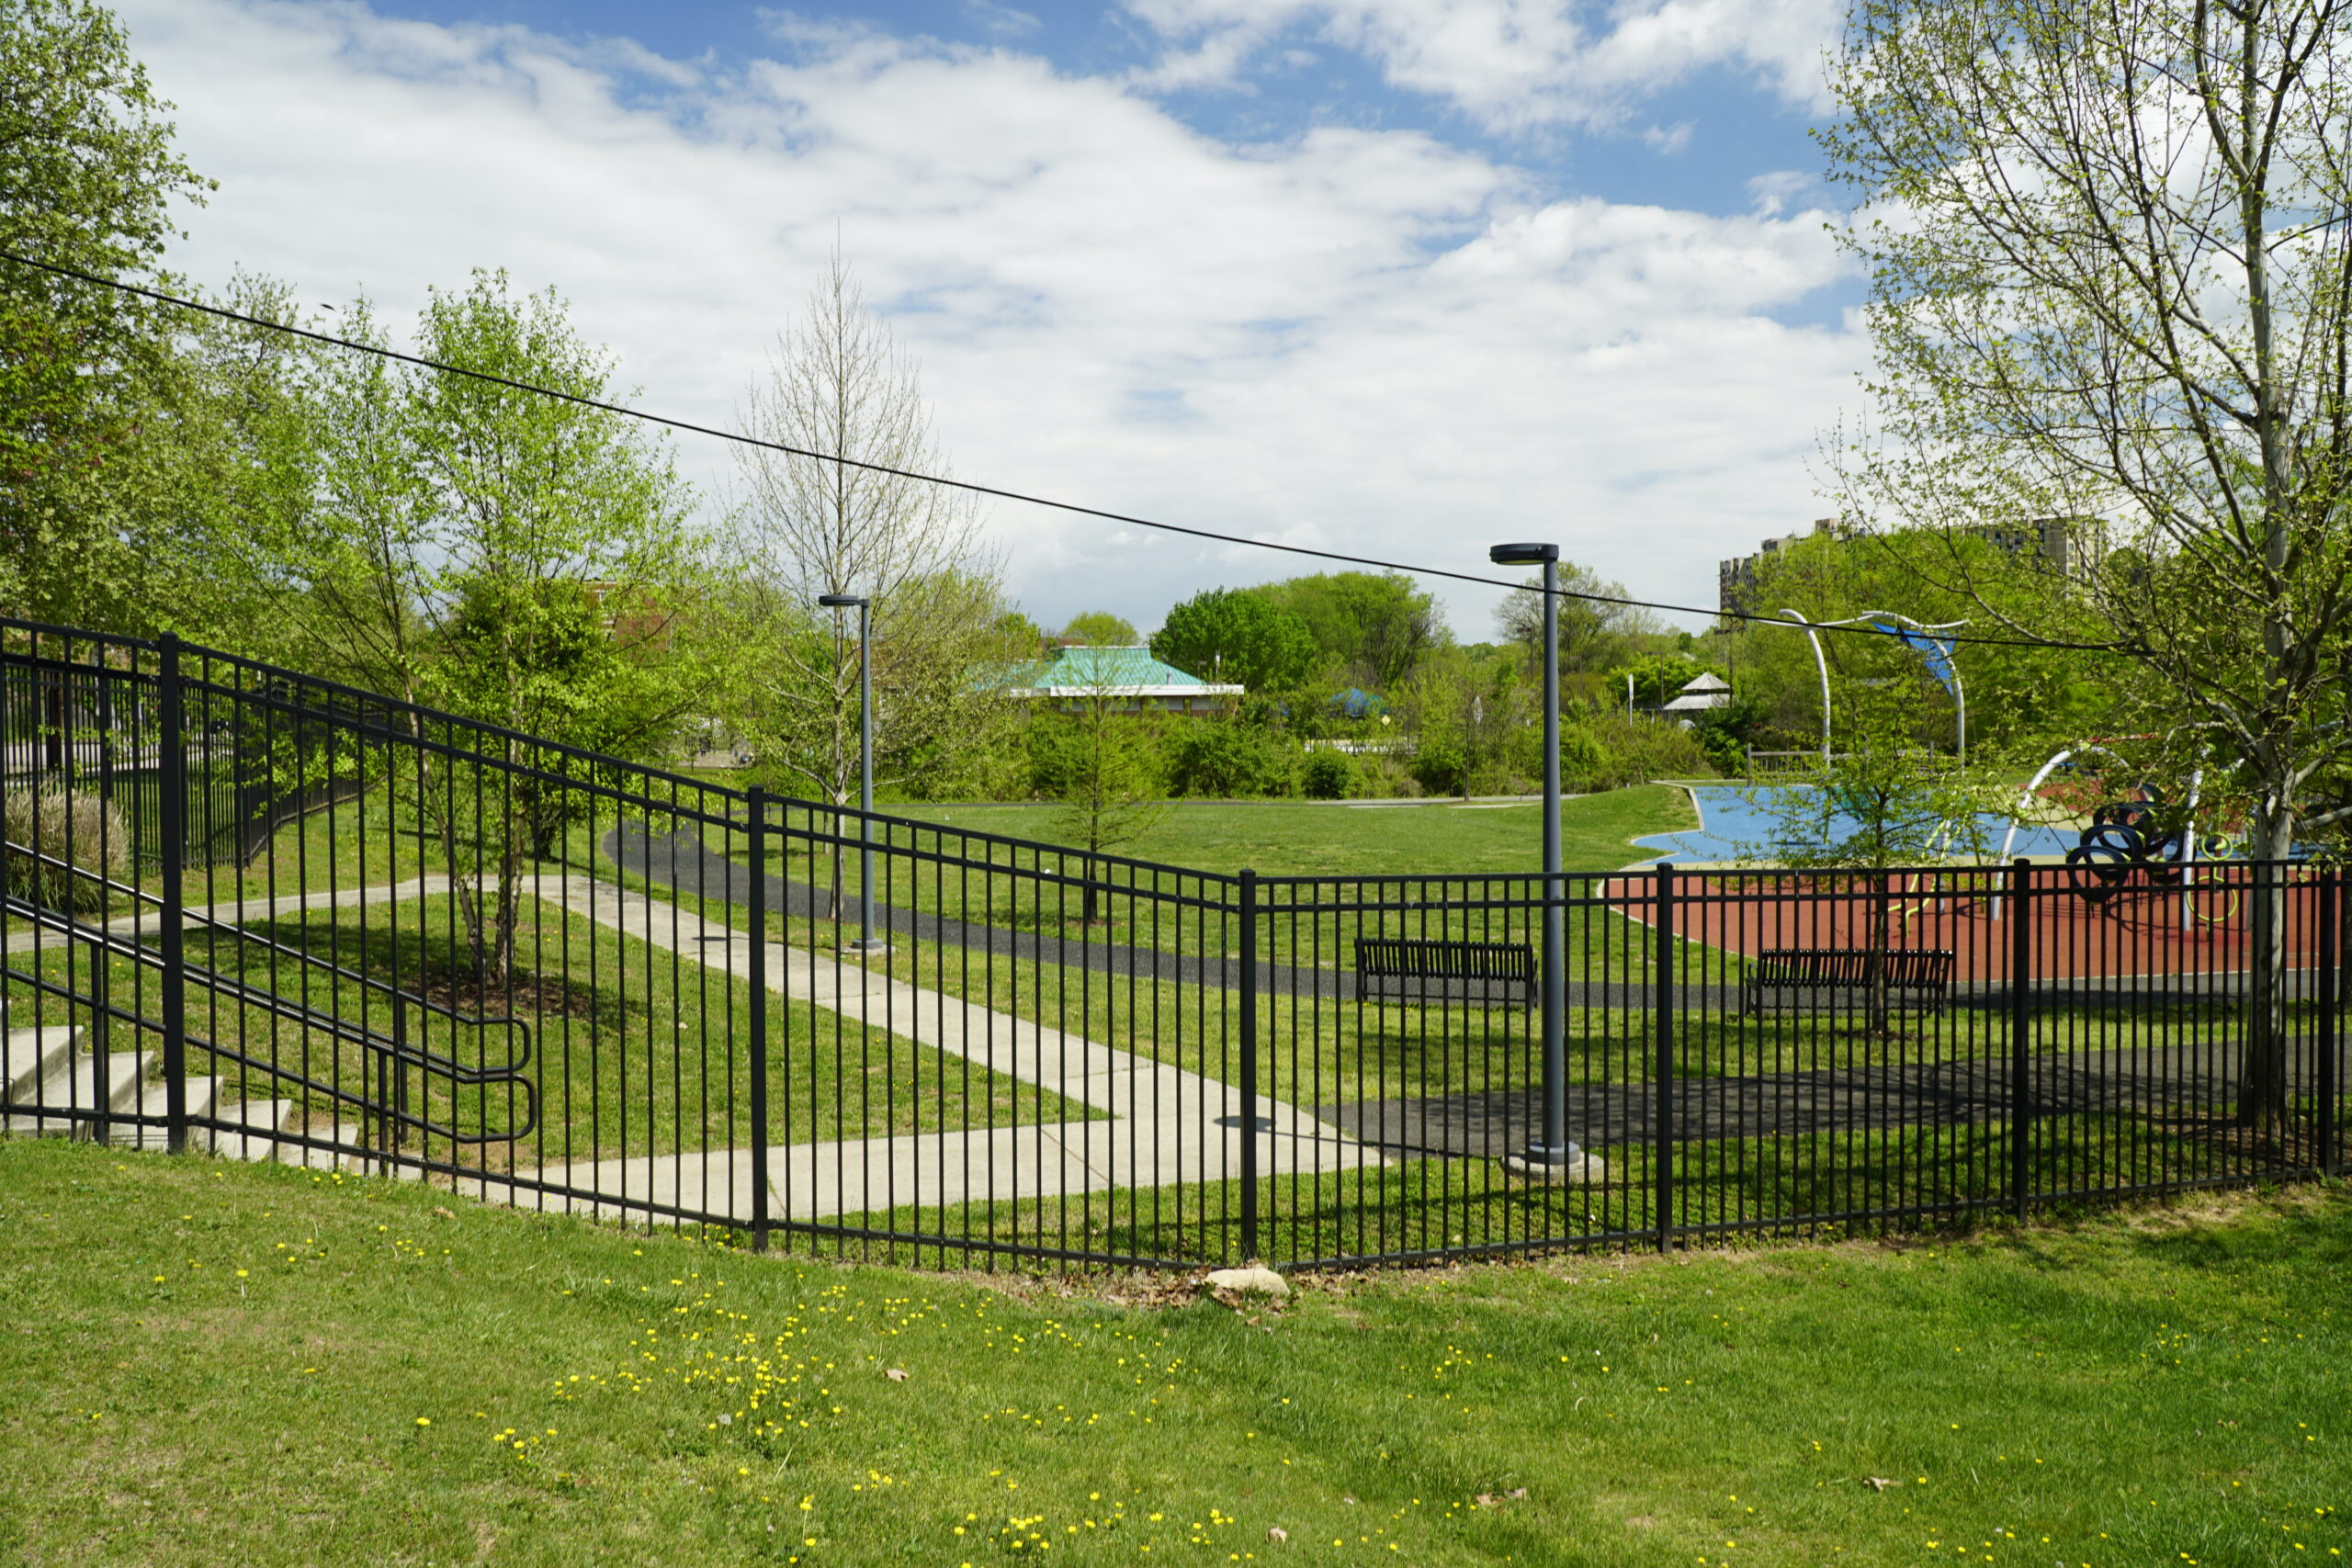
Simon Elementary, near Oxon Run in Ward 8, is a RiverSmart school. The RiverSmart program, administered
by the District Department of Energy and Environment, promotes green infrastructure stormwater solutions
across Washington, DC. For Simon Elementary that means they’ve built rain gardens into their playground
spaces, which filter and slows stormwater from heavy rains reducing negative impacts to streams and
rivers. The raingardens are planted with native grasses, shrubs and trees, providing wildlife habitat
and environmental benefit, while exposing students to environmental education concepts through
demonstration.
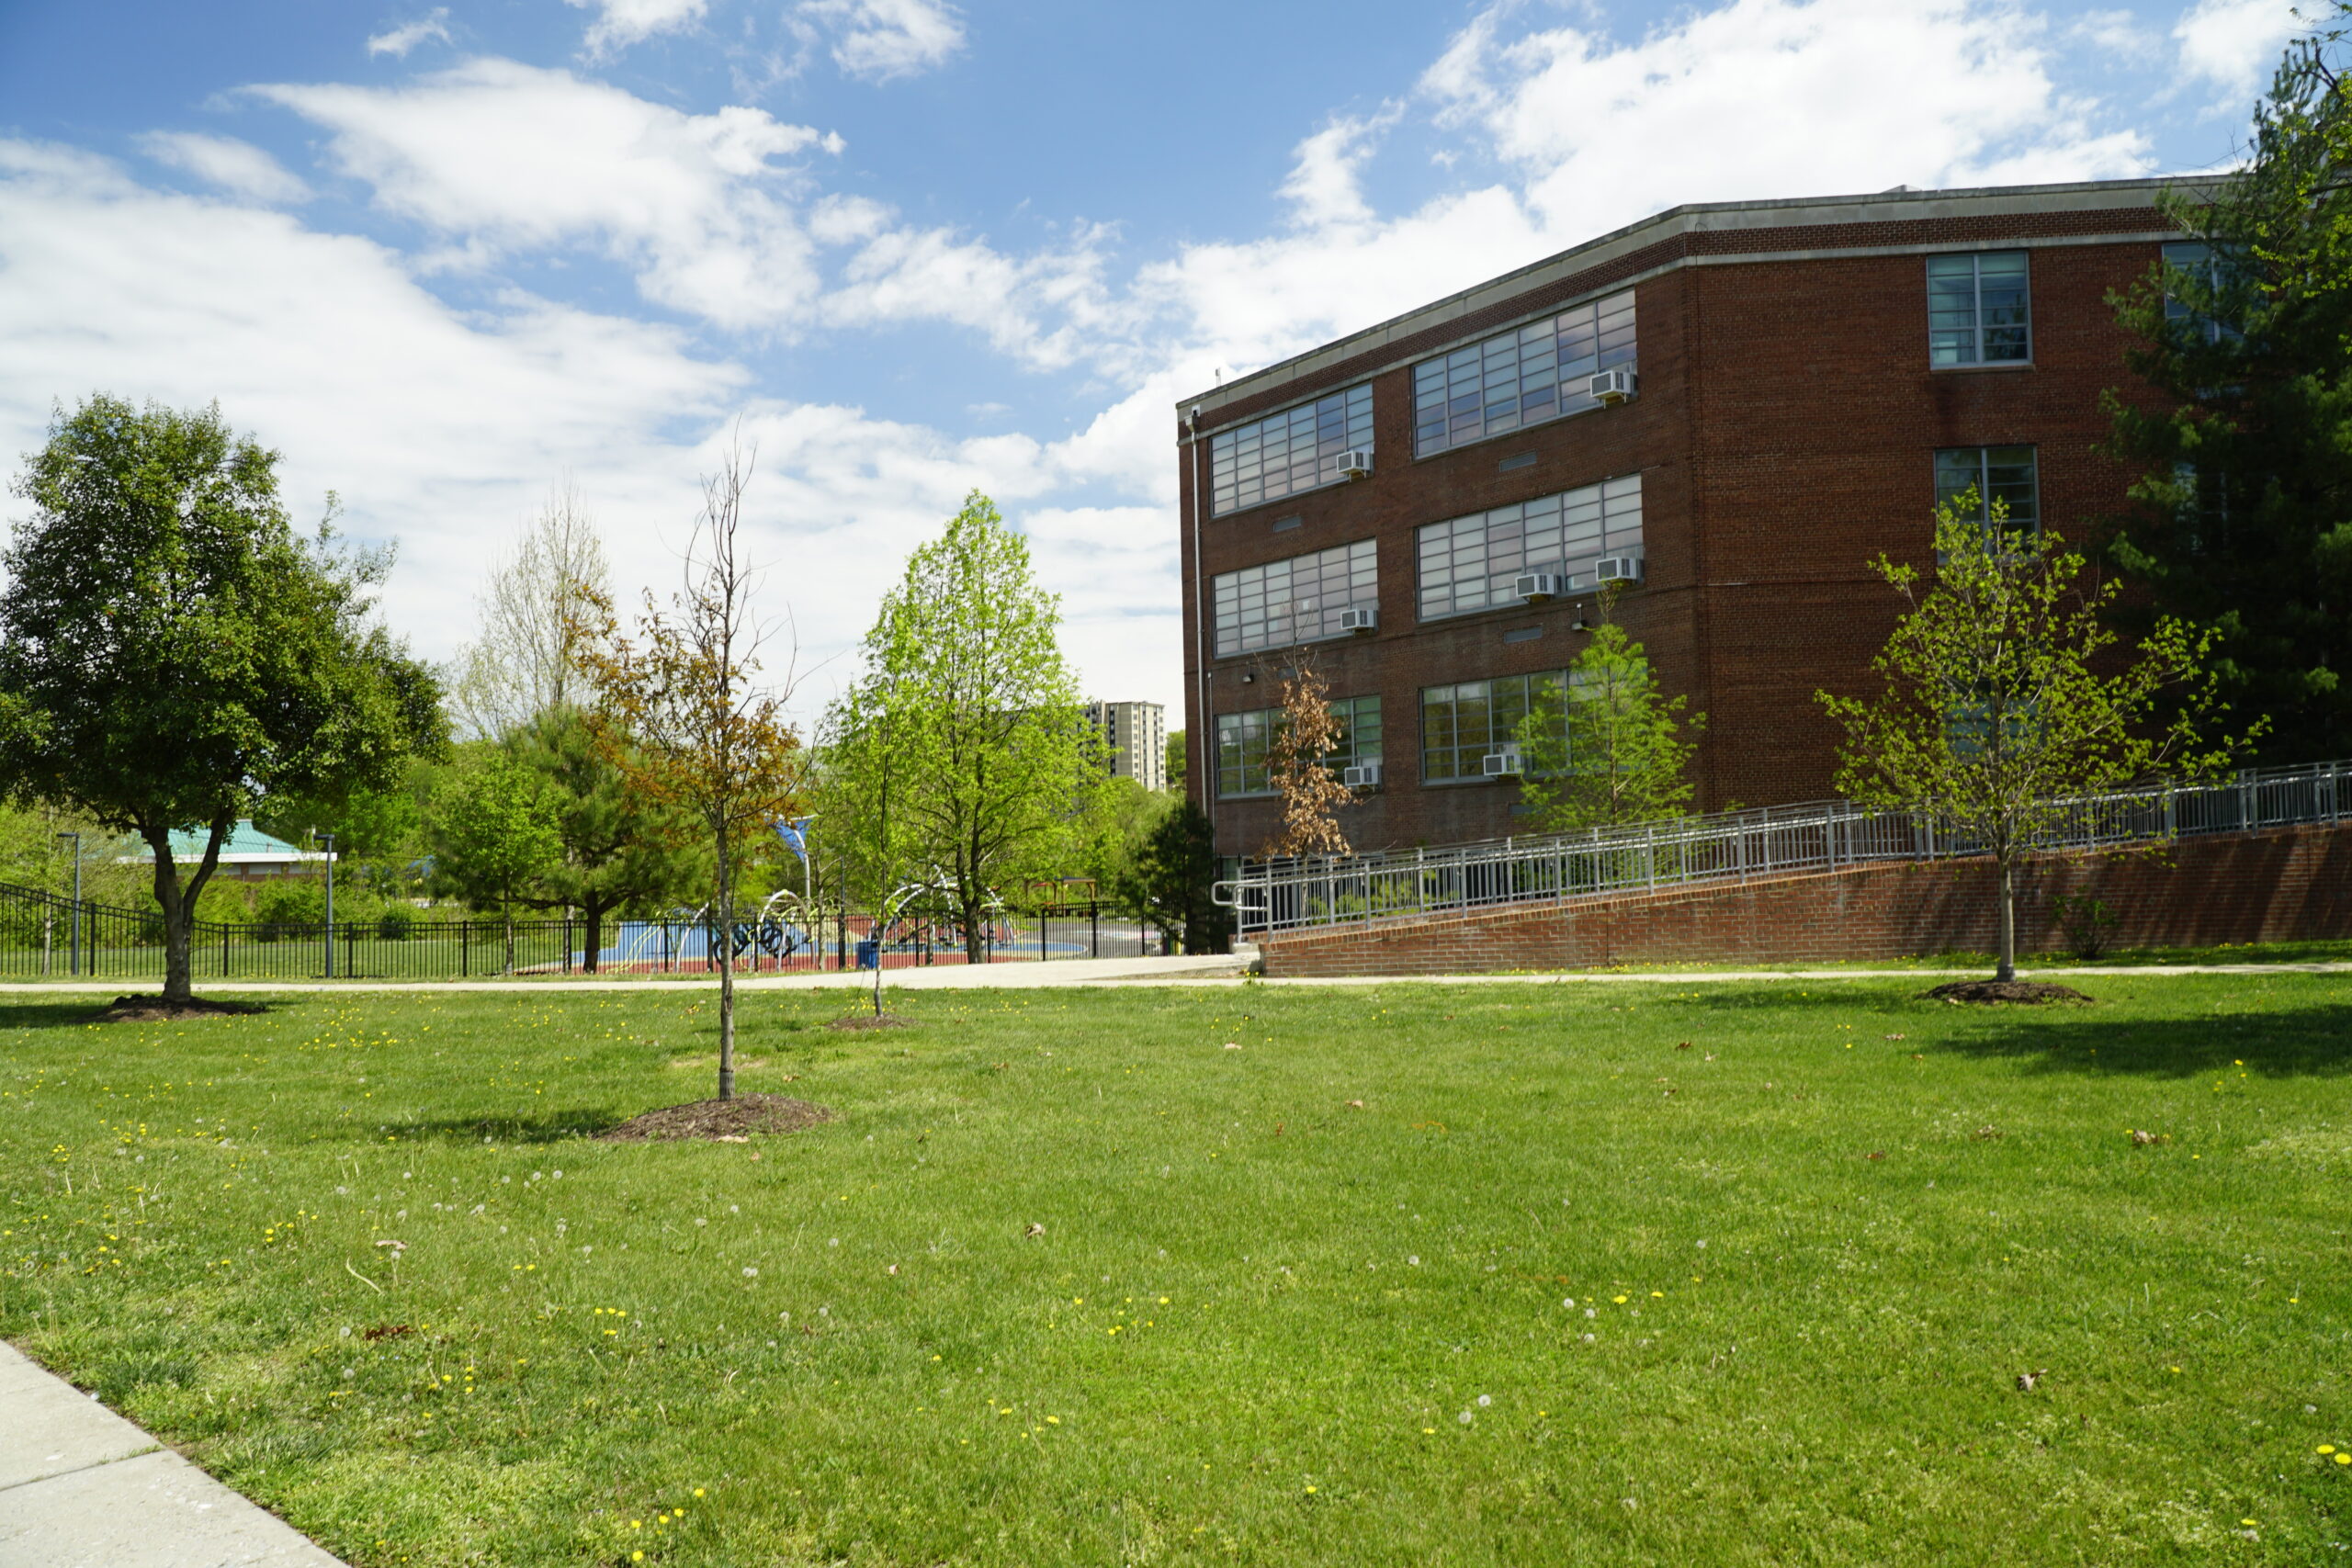
Simon Elementary’s tree canopy is mostly on the Mississippi Avenue side of the school. Significant campus
land area is dedicated to play and recreation space, and Oxon Run Park is located directly behind the
campus. Compared to most other schools, Simon has well above the average tree canopy and 50% of their
grounds are covered in vegetation – partly due to the extensive rain gardens. However, with 22% existing
and 43% potential tree canopy, there are still plenty of areas on campus that accommodate tree planting
without impacting the schools’ active recreational spaces.
School Planting and Environmental Education Programs
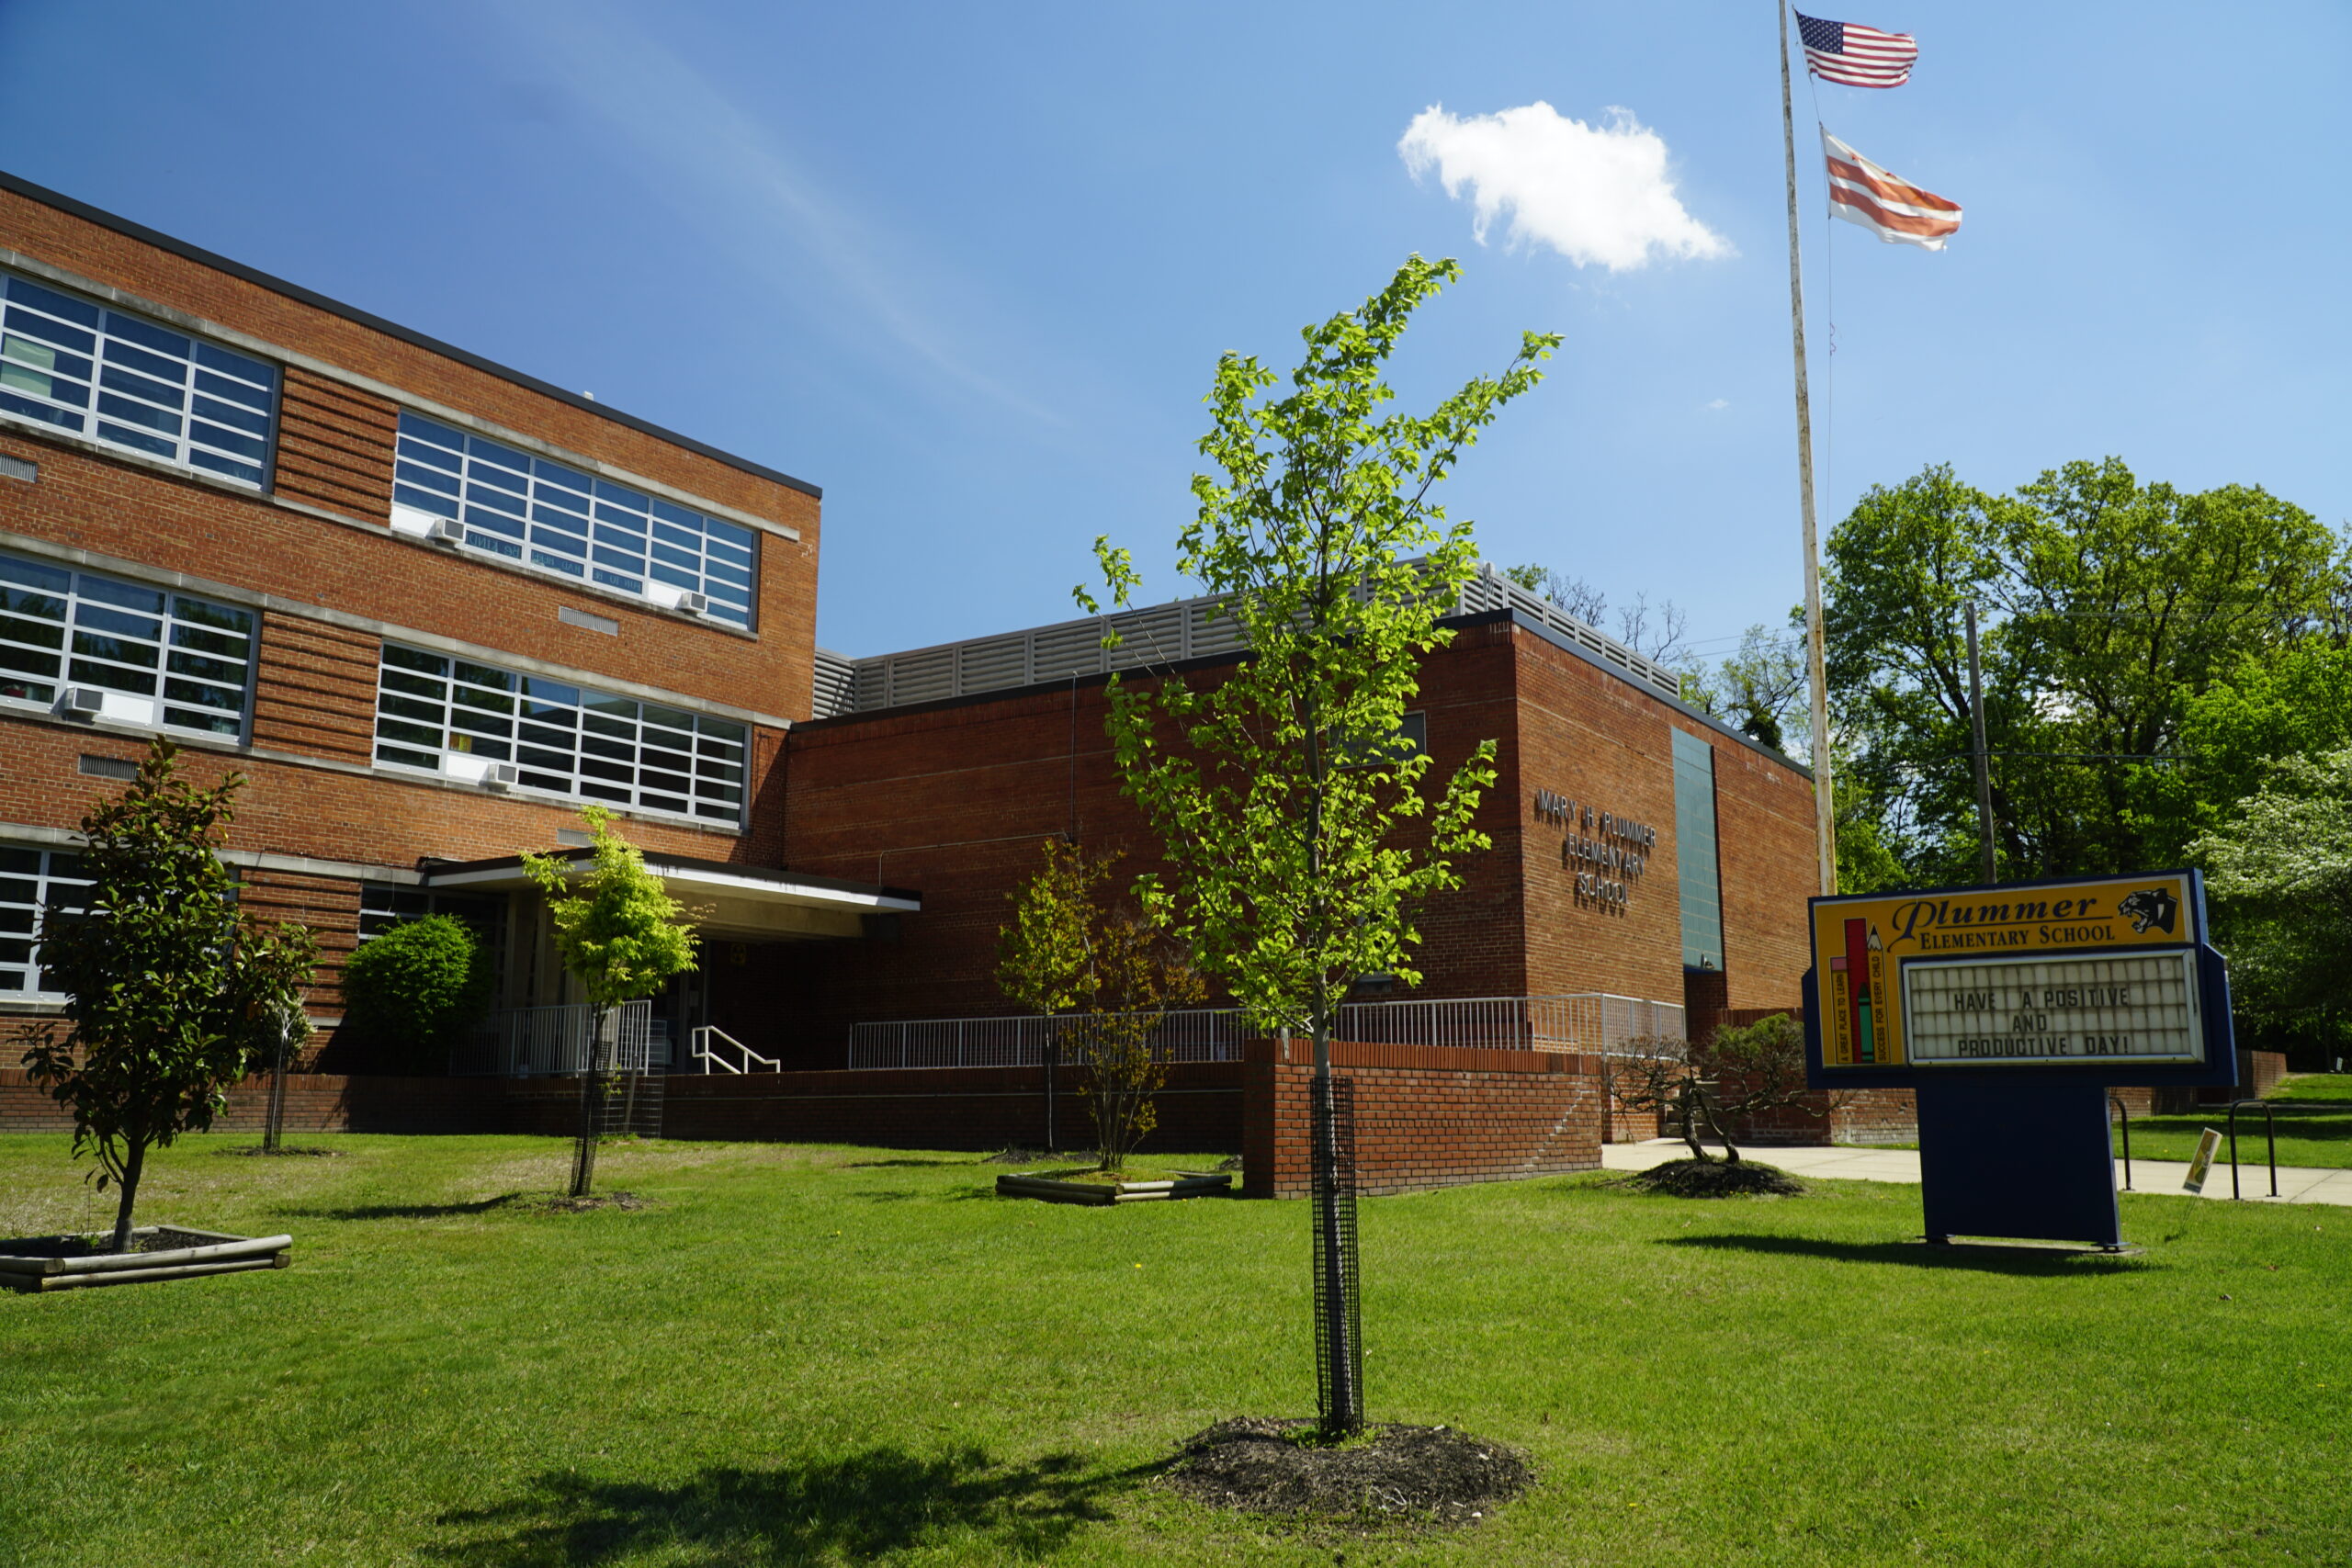
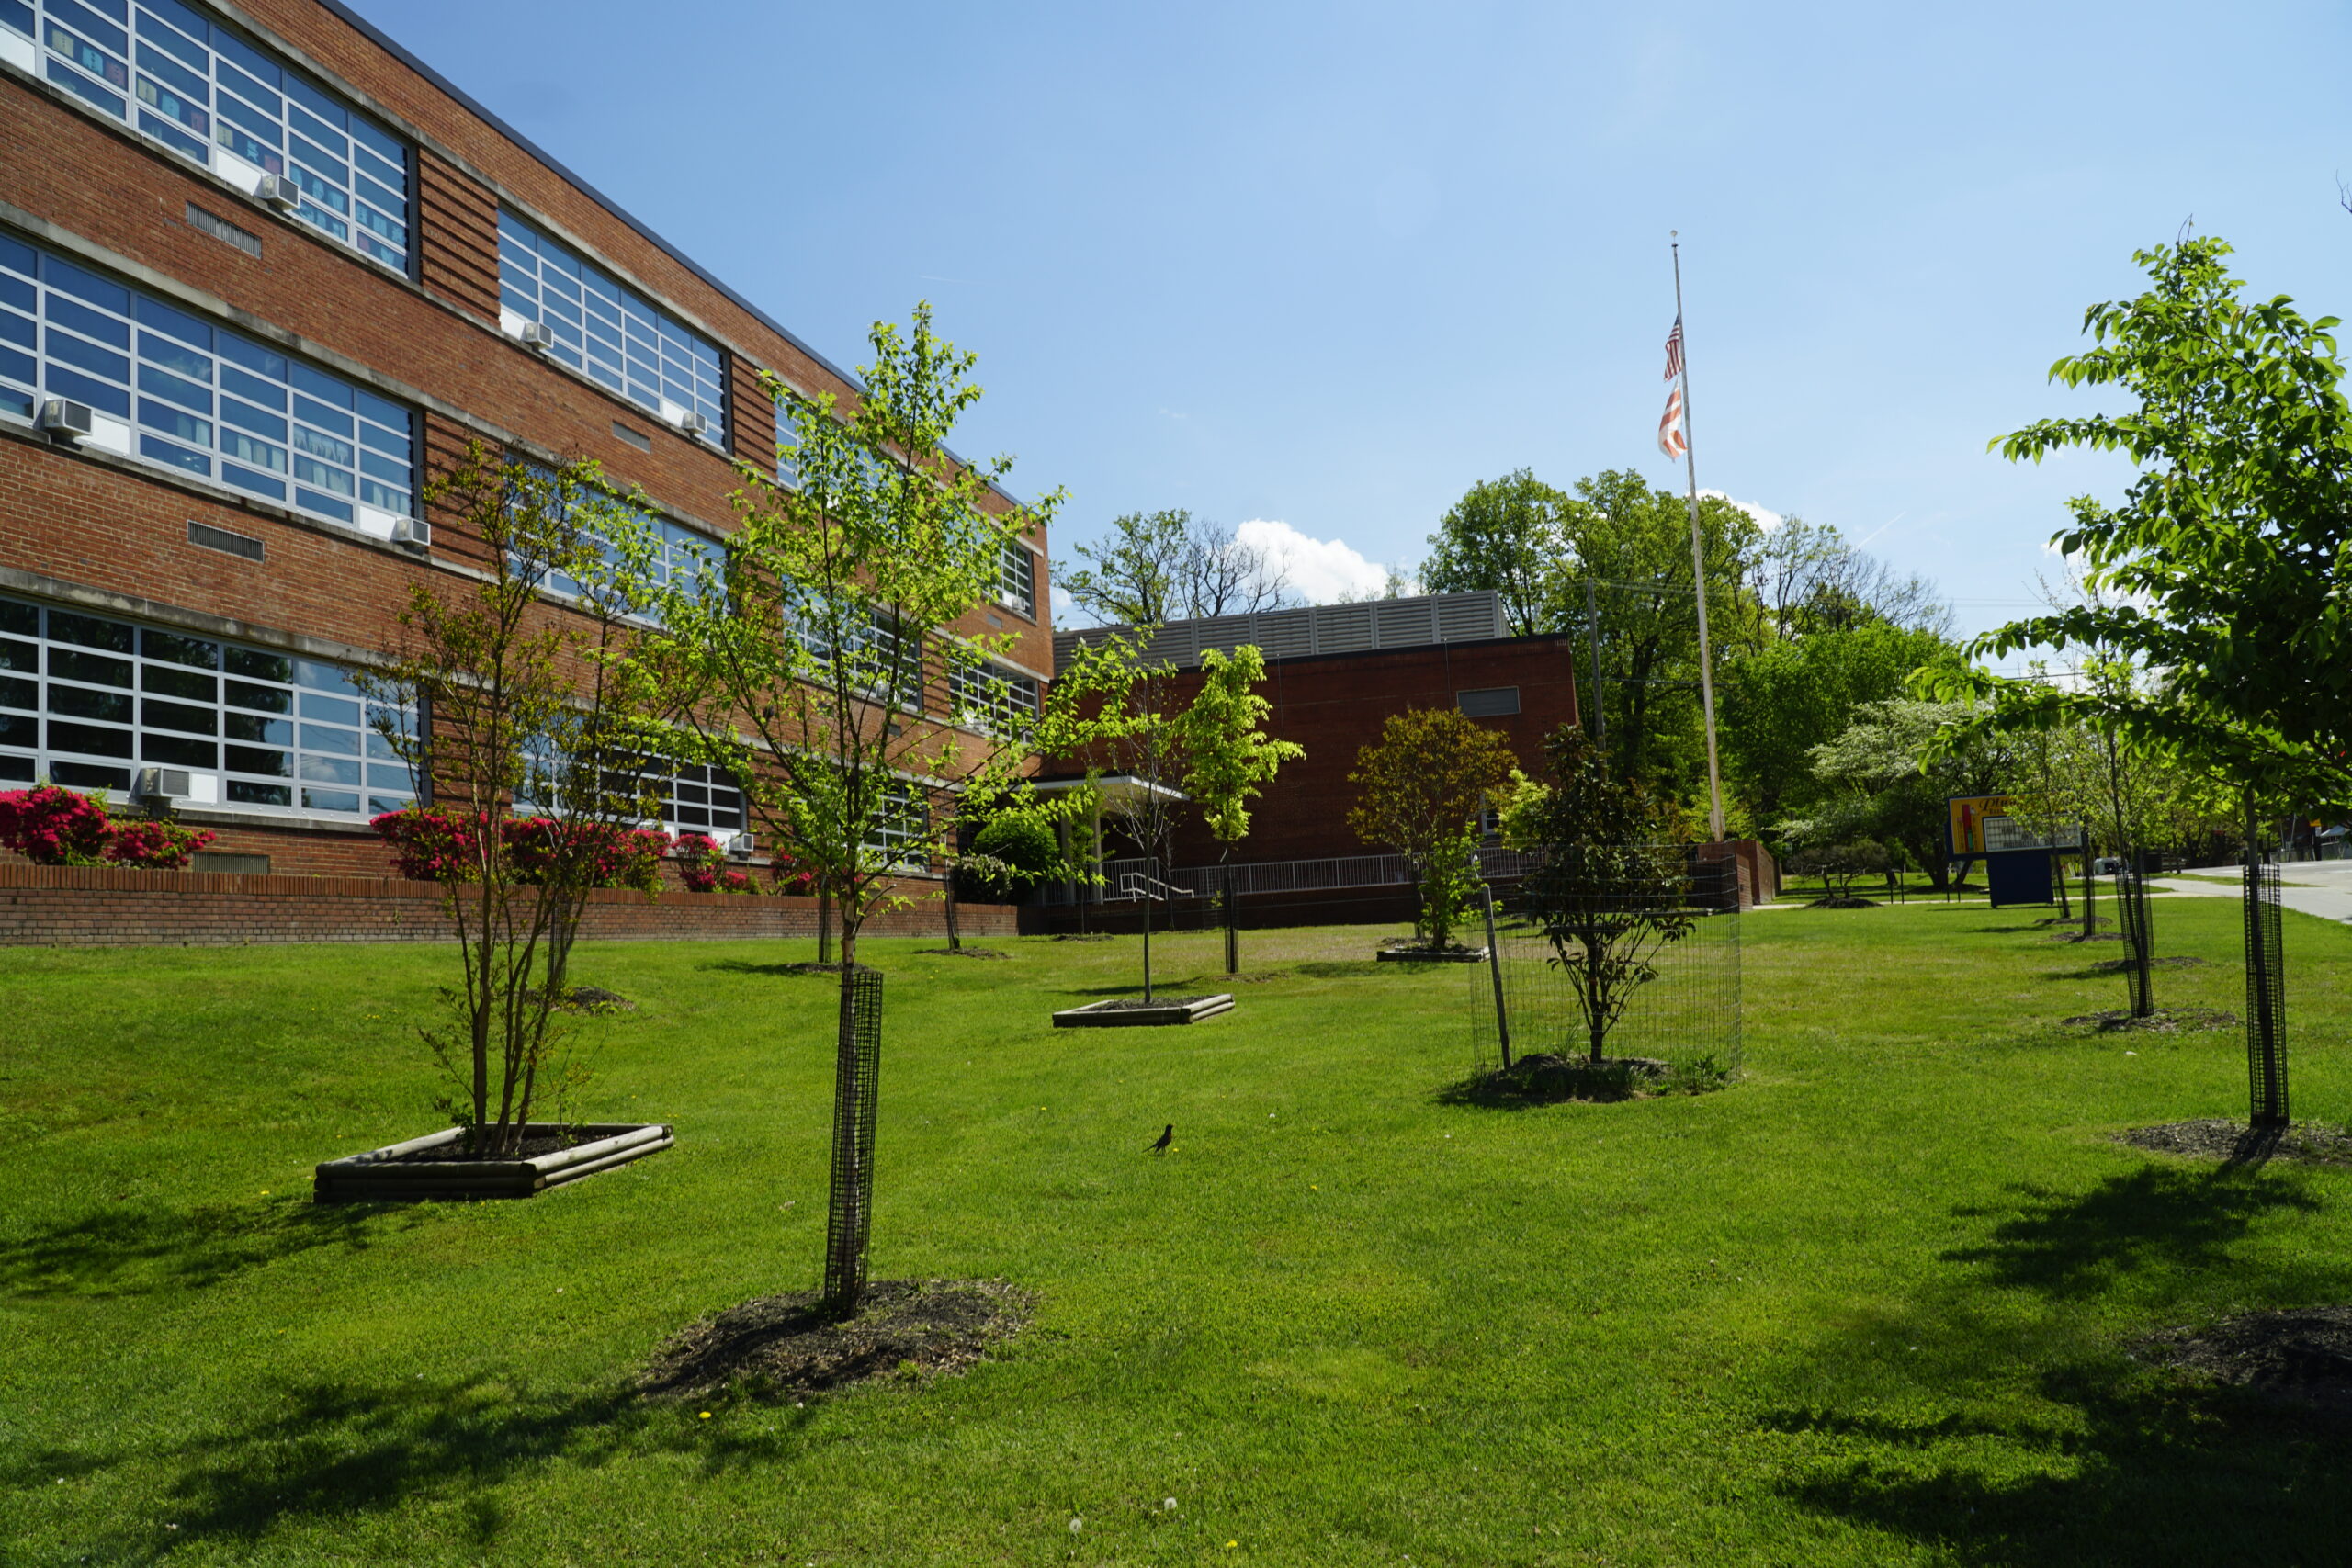
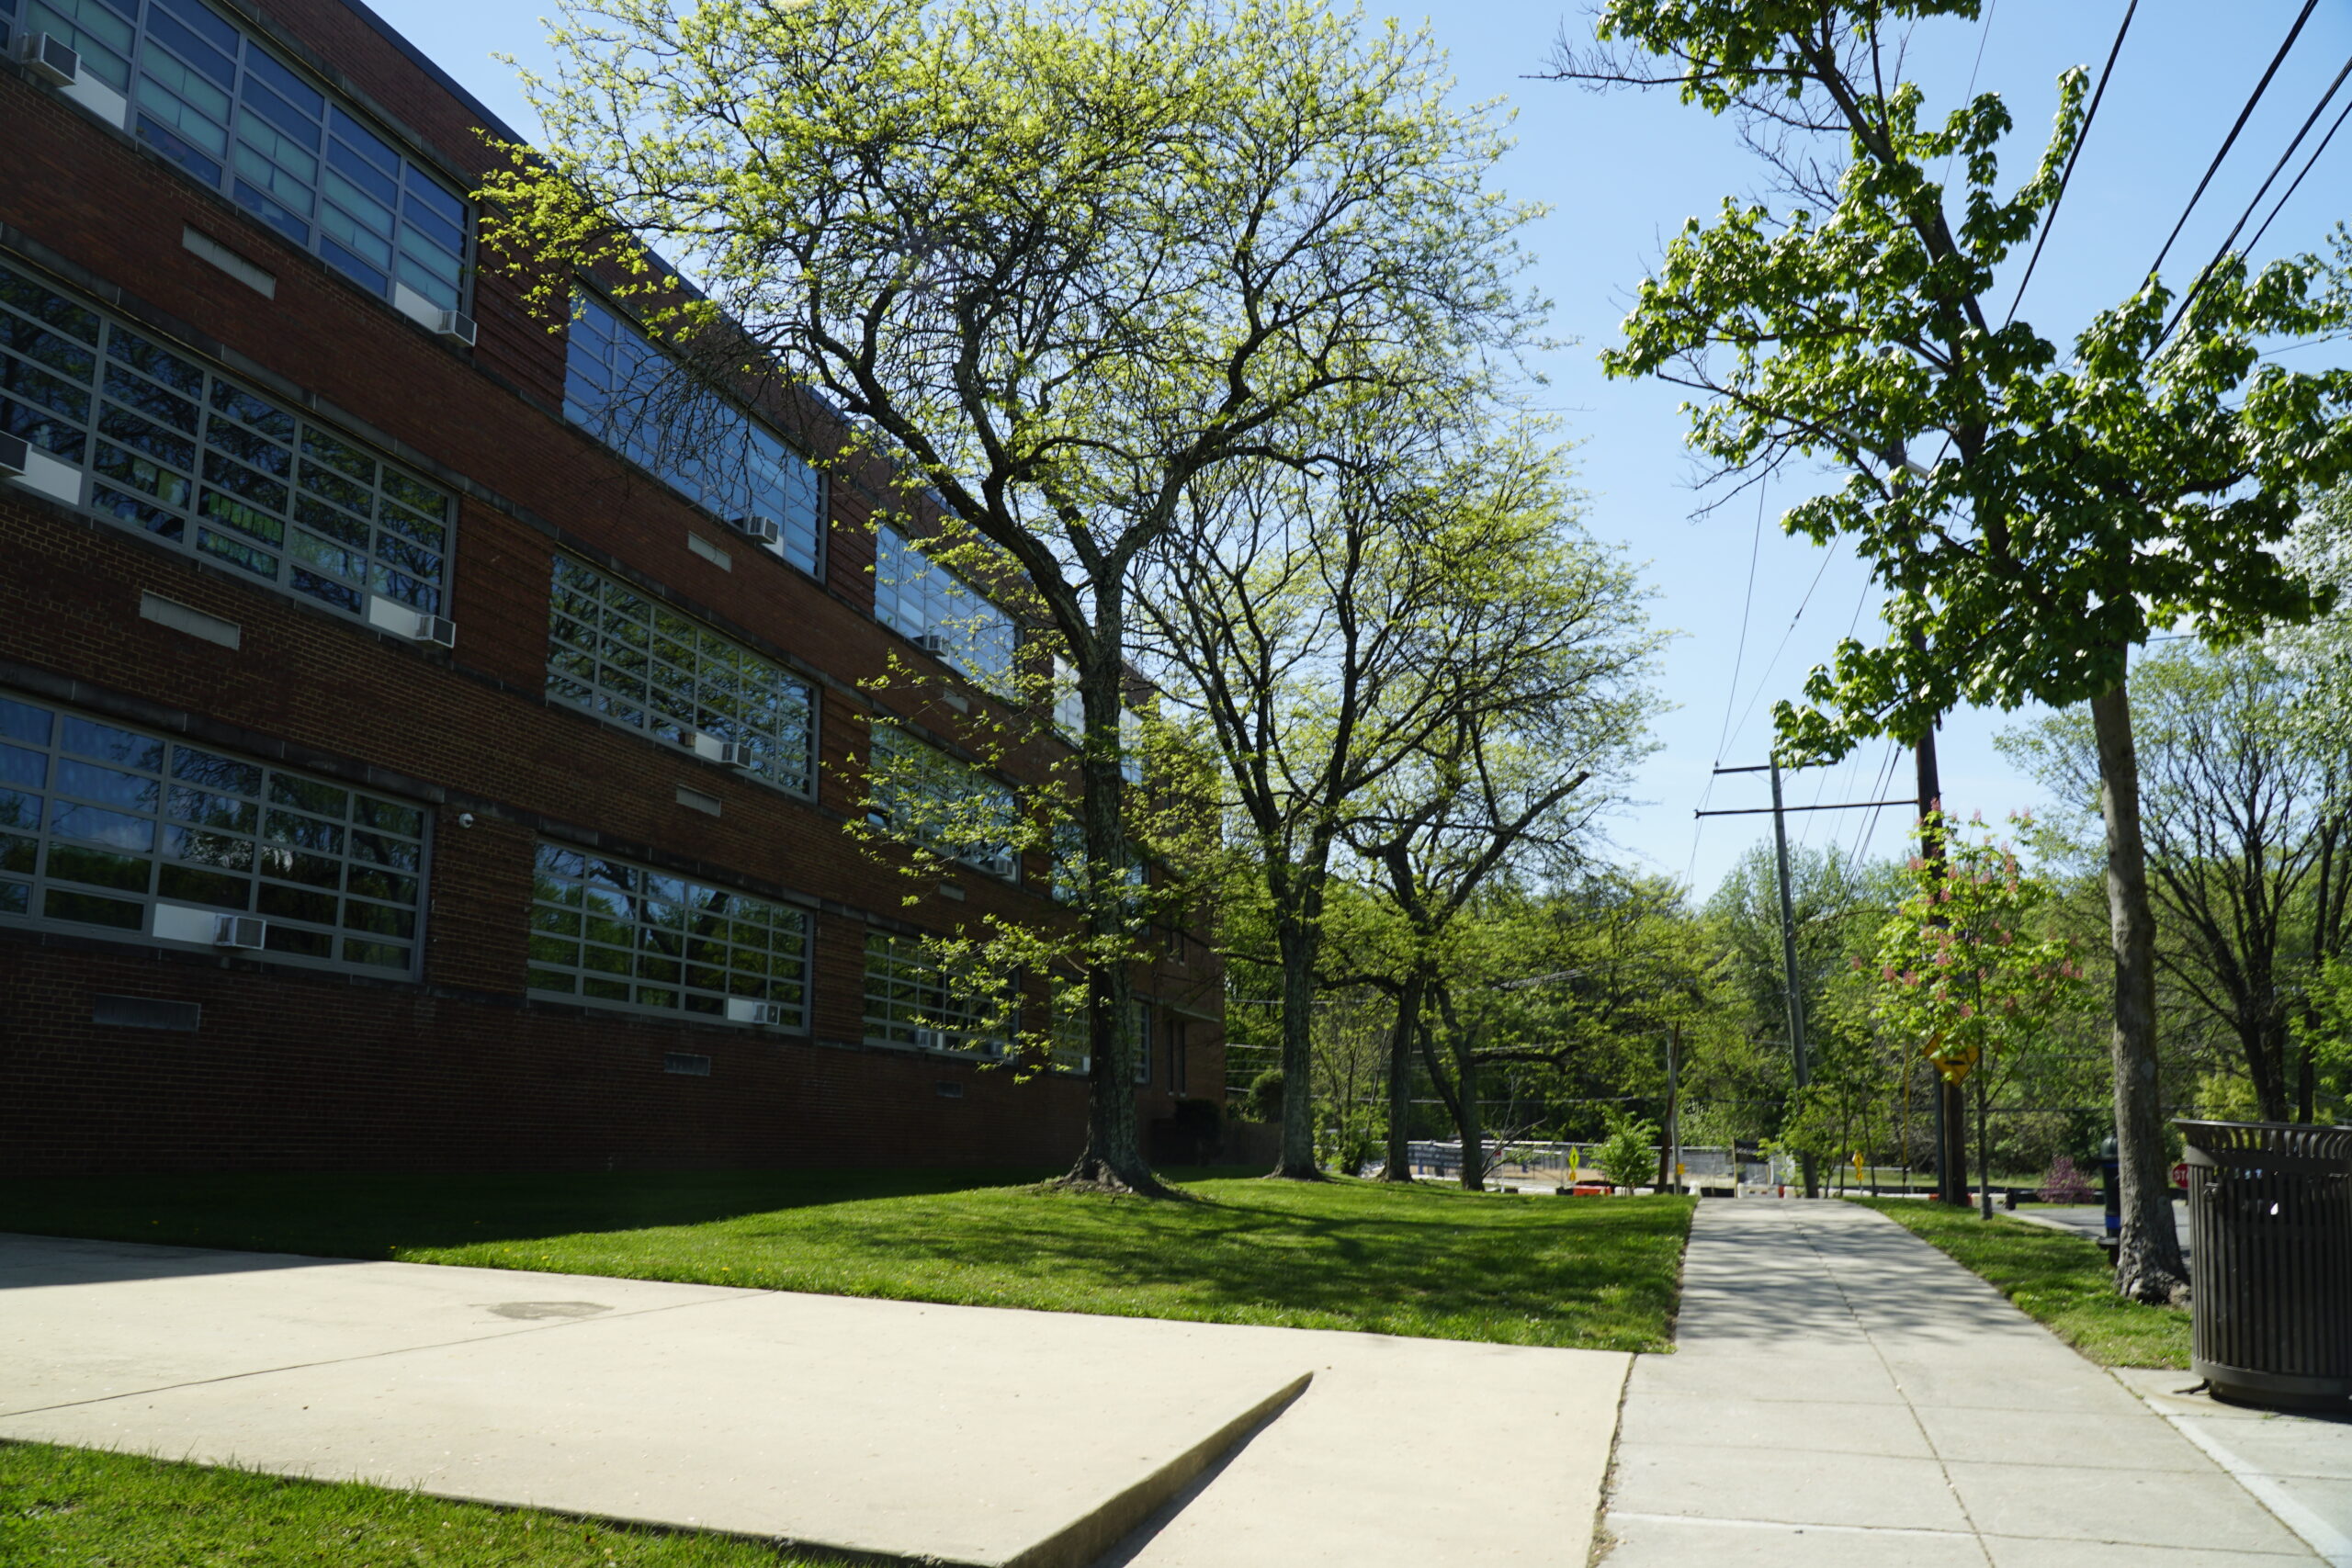
Plummer Elementary School
Ward 7
Current Canopy Cover: 6.7%
Potential Canopy Cover: 11.5%
Plummer Elementary is in the Benning Ridge neighborhood of Ward 7, near Fort Chaplin Park. Plummer’s
current canopy of 6.7% is low, but with 11.5% potential canopy, the school could effectively double its
tree cover – a significant improvement. To help bridge that gap, Casey Trees recently planted 30 trees
of 14 different species, most of which will grow into large, mature shade trees, at Plummer in the
spring of 2023.
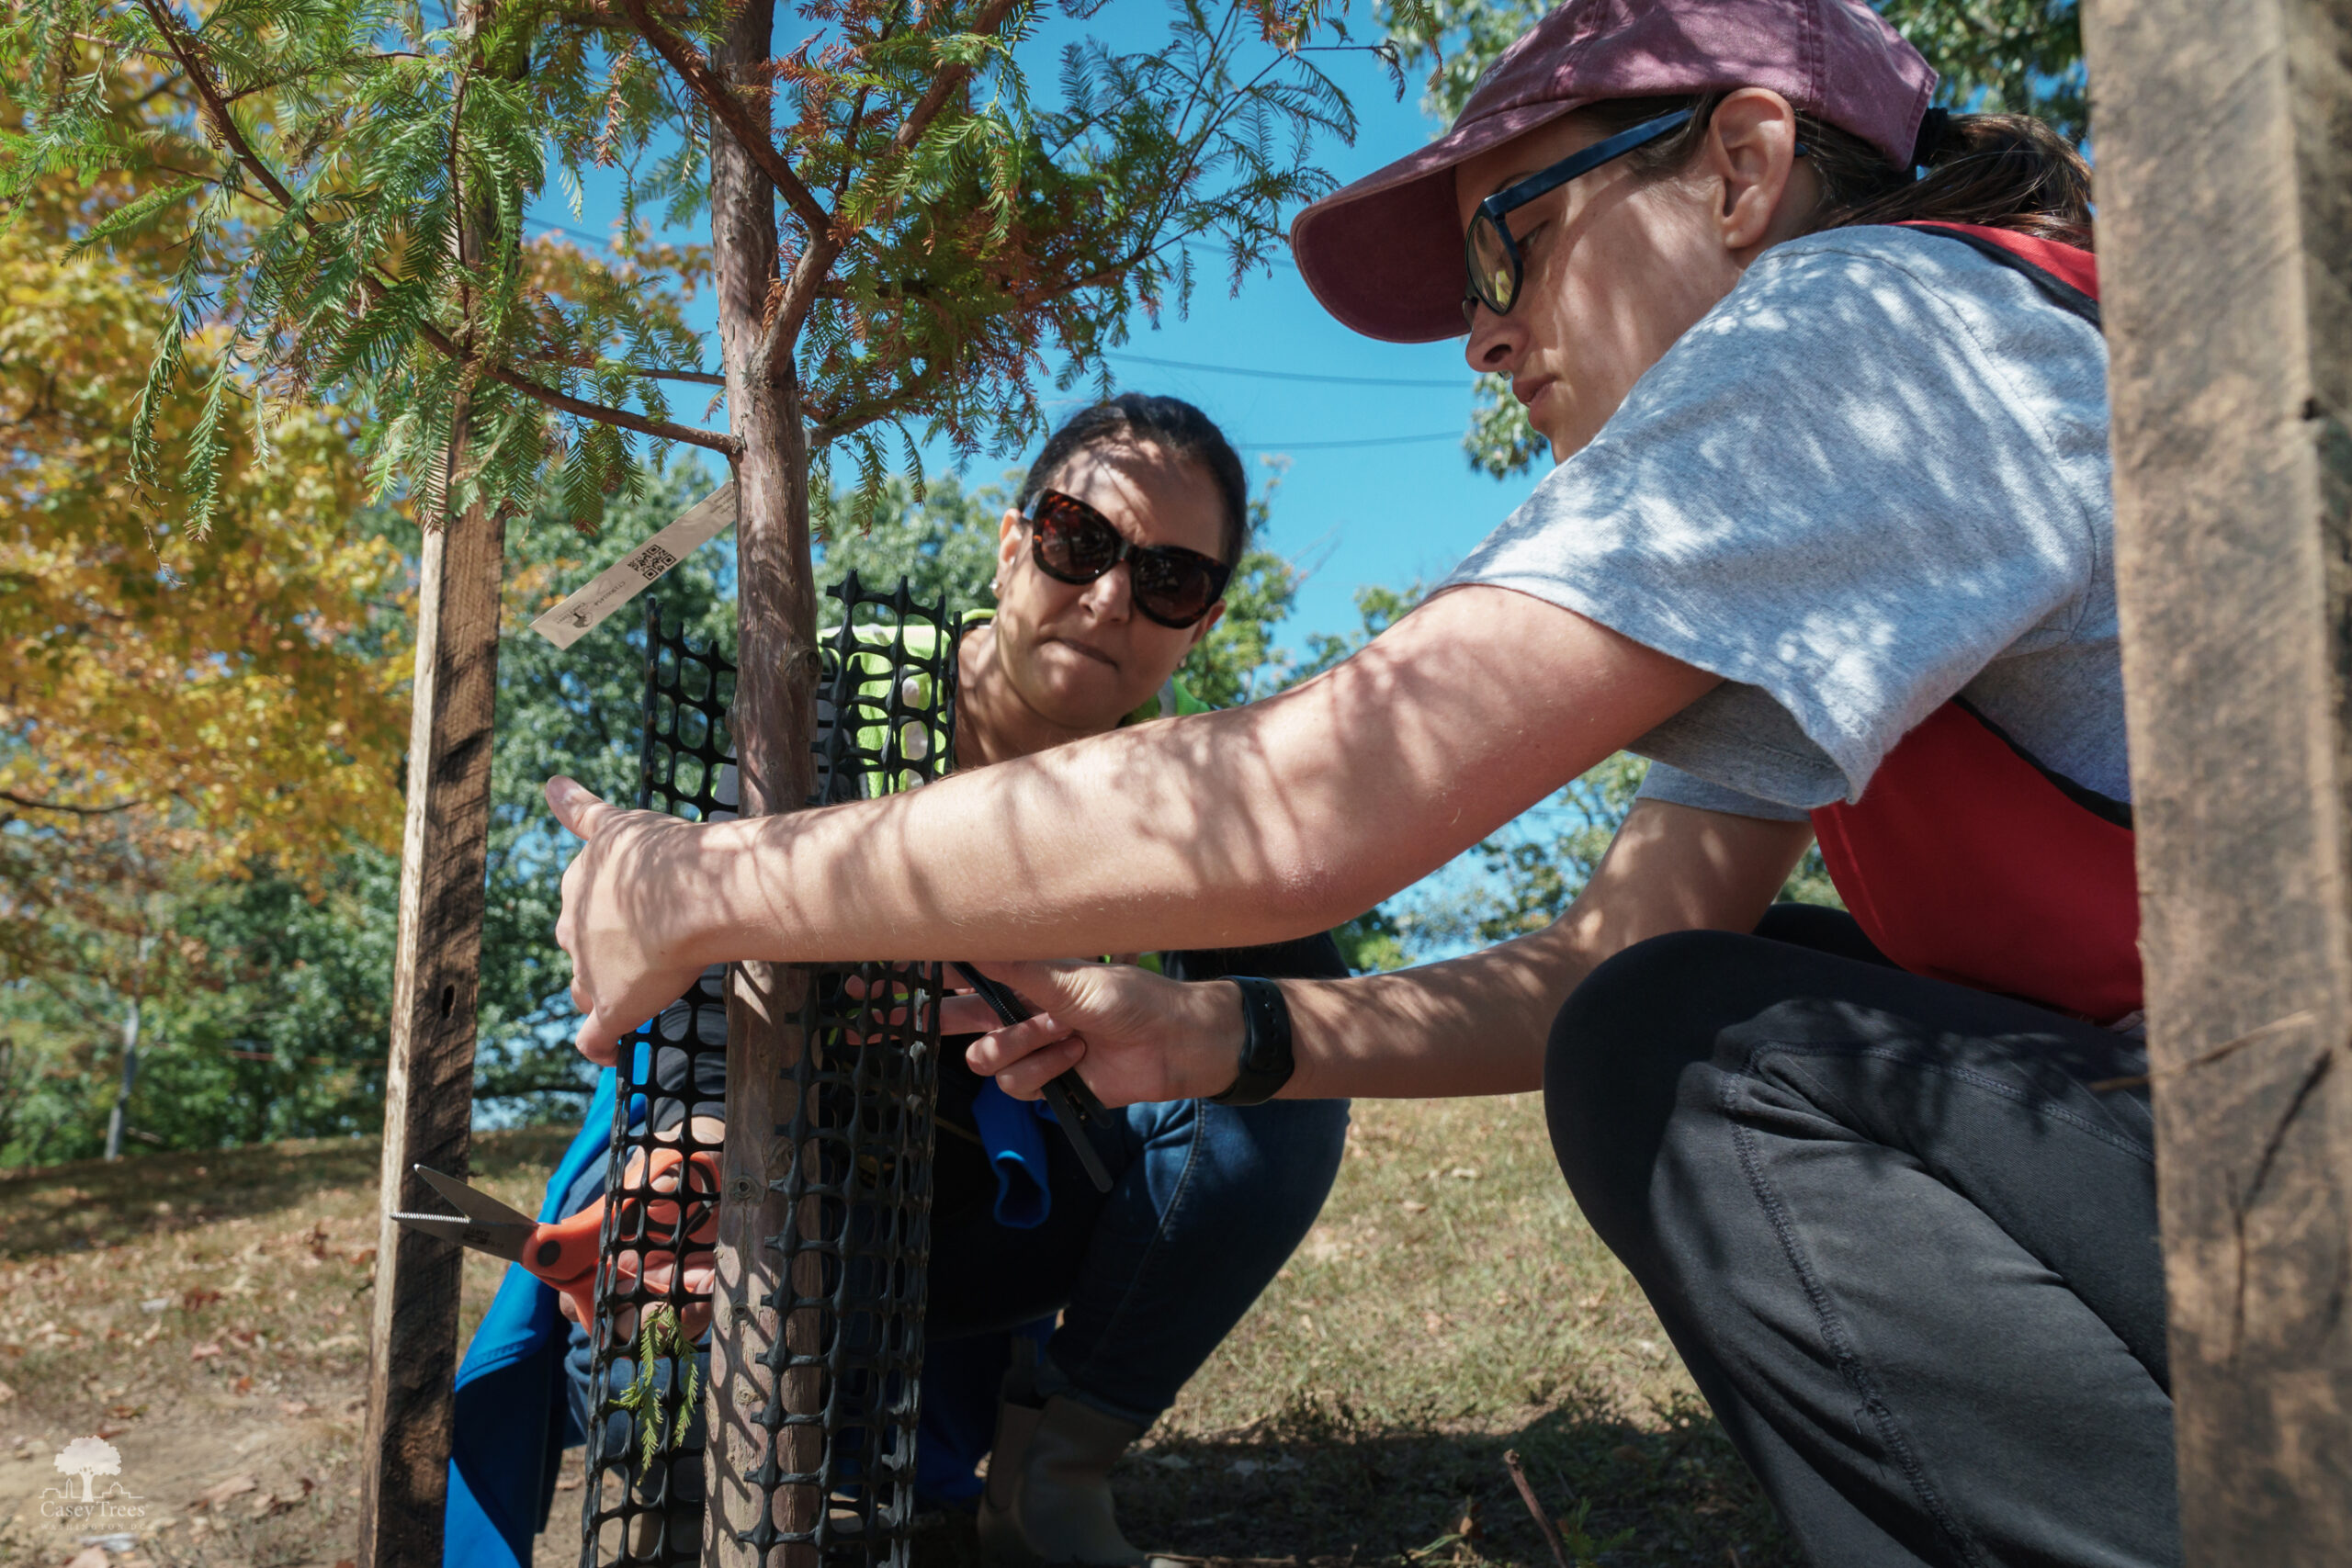
In addition to tree planting, Plummer Elementary participates in Casey Trees’ Nature Near Schools program
with our partner, Urban Adventure Squad. This program brings environmental education directly to
students through hands-on outdoor learning opportunities such as teaching critical thinking through tree
identification keys, science lessons focused on urban water cycles, storm drain art projects and related
activities.
Conclusion
Our schools influence future generations and how they value trees, greenspaces, forests and the natural
world. That’s why since our founding, Casey Trees has engaged schools, planting trees to revitalize
campuses, while teaching students both indoors and out about the importance of trees and how nature can lend
balance to our lives – findings that are based in science. A Stanford-led
review of over 100 studies revealed that environmental education significantly improves critical
thinking, teamwork and collaboration skills – an important counterbalance to our growing, and more isolated,
digital world.
Many programs are available to re-tree school grounds, and bring nature to the classroom. The District
Department of the Environment’s (DOEE) RiverSmart Homes program offers free trees for school reforestation.
DOEE’s Nature Near Schools and Meaningful Watershed Education Experience Grants help facilitate hands-on
outdoor learning programs. This year alone Casey Trees has served 26 schools through its environmental
education programs in the 4th and 5th grade.
An actionable first step to increased multi-level school engagement is simply to make school campuses
greener, and from the data showcased in this report, there’s plenty of room for improvement. We urge the
District Department of Energy and Environment to lead this charge under its Sustainable DC program, working
with partners both in and outside the DC Government to prioritize and fund this effort.
In the meantime, you can act now. If you are an educator, student, parent or simply an interested resident,
and you want to re-tree your school or a school in your neighborhood, drop us a phone call or email. Casey
Trees can help.
Metrics
metrics
The Tree Report Card is Casey Trees’ annual evaluation of DC 's urban forest. It looks at where our successes
have been over the past year and highlights where improvements can be made. This year, Casey Trees is
pleased to announce that the District received an overall grade of B+.
Grade components explained
The Tree Report Card rates Washington, DC’s urban forest based on four metrics: Tree Coverage, Tree Health,
Tree Planting and Tree Protection. Each metric is evaluated using a standard formula and given a letter
grade. This year’s overall grade of B+ is based upon the average of four categories
that are graded individually and explained in detail below.
This metric measures the quantity of tree canopy covering District land. Aerial imagery – both satellite and
fly-over images – is used to measure the City’s tree canopy from above and track progress toward DC’s 40
percent tree canopy goal on a 5-year cycle. The most recently collected data measured a 1% decline in canopy
from 2015-2020, and canopy cover remains at 37%; therefore, Coverage receives an A-
Grade.
0%
Calculations Explained
Existing tree canopy coverage/Tree canopy goal
37/40 = 92%
Tree Health
This metric evaluates the quality of tree health and condition across the District on all lands – private and
public – both DC and federally-owned. The grade was taken from the results of the USDA Forest Service’s
(USFS) Forest Inventory and Analysis (FIA) survey.
FIA is a sampling method used by USFS research to assess forests across the United States. More recently it
is being deployed to look at the conditions of trees in US cities, DC being one of them.
From the FIA results, there are approximately 2 million trees within the District of Columbia. Of these 2
million trees, 90% of fell into the condition class of either “excellent” or “good,” resulting in a tree
health grade of A-.
0%
Calculations Explained
Healthy trees/ Trees surveyed = 90%
Tree Planting
This metric compares the number of trees planted each year to the number required for the City to meet its
40% canopy goal. In total, 12,957 trees were planted by the City and its
partners in 2023. This far exceeds
the City’s annual planting target of 10,500 trees. The Tree Planting score for this year’s Tree Report Card
therefore receives an A+ grade.
0%
Calculations Explained
Total trees planted/tree planting goal
12,957/10,500 = 123%
Tree Protection
This metric measures the effectiveness of the City’s laws in protecting Special and Heritage trees. The final
grade for Tree Protection, is based on the average of the following three
sub-metrics, as follows:
0%
Calculations Explained
Average of Submetrics
Sub-metric 1: Are the fees/fines
required to remove Special trees keeping pace with inflation? The fee to remove a
Special tree, set in 2016, is $55 per inch of circumference. In order to keep pace with inflation, that
figure should be about $71 today. While this difference may seem small, it translates to an overall loss
of $530,384 in fees, equivalent to fewer trees planted. We
therefore assign this submetric a C grade. Tree fund permit receipts:
$1,823,917, adjusted for inflation would be $2,358,301
Sub-metric 2: Are fees and fines
being used to plant replacement trees? The Urban Forest Preservation Act requires that
fees and fines from tree law violations collected into the Tree Fund be used to plant trees on public
and private land. Over the past three years approximately $300,000 in fines collected through Notices of
Infraction were directed by the Office of Chief Financial Officer to the General Fund rather than the
Tree Fund and so are not being used to plant replacement trees. Casey Trees has petitioned the Office of
Chief Financial Officer to address this issue, but until rectified this metric
receives a Failing grade.
Sub-metric 3: Are Heritage Trees
being protected according to the law? We do know that most Heritage trees are being protected: There were 278 requested removals of
Heritage Trees ultimately denied because the trees were healthy, and 18 known illegal removals. While
any illegal removal of a Heritage Tree is cause for concern, the number of illegal removals has declined
from last year, indicating our newly strengthened tree laws are working. This
metric receives an A- grade.[1]
This year's overall grade is a B+, calculated based upon the four categories.
0%
Calculations Explained
Calculated Average = 89%
Recommendations
1
Lower the Special Tree threshold from 44” circumference to 25” circumference.
As we reported last year, despite its robust regulatory environment, DC continues to lose tree canopy.
Lowering the circumference limit for Special Trees will protect more trees and slow canopy loss. This
provision is in the Tree
Enhancement Amendment Act of 2023, currently under consideration by the DC Council.
2
Increase fees and fines for the removal of Special and Heritage Trees to account for
inflation. This is the fourth year the TRC made this recommendation, including most recently the
Tree Enhancement Amendment
Act of 2023. This adjustment is overdue and has resulted in the loss of thousands
of replacement trees.
3
Ensure all fees and fines are deposited to the Tree Fund as required by
law. Fines collected through the Office of Administrative Hearings have been misdirected to the
City’s General Fund. Casey Trees testified to the Office of Chief Financial Officer regarding the
misdirection at Performance Oversight hearings and asks OCFO to prioritize getting this process rectified.
Protect environmentally sensitive open spaces and forest patches from being
developed by working with the DC Council, District agencies, and private landowners to identify
greenspace that could be conserved in easements to further climate resilience and community access.
6
Establish tree canopy goals for public and private schools/universities. As
spotlighted in our Tree Report Card this year, our city’s public schools average 13% tree canopy, far lower
than the citywide goal of 40%. When students are taught in a green learning environment, they not only
internalize the benefits that trees and greenspace offer – they also pass that lesson along to others in the
communities where they live.
7
Fully fund environmental education programs in schools. In next year's budget,
funding for programs mentioned in this Tree Report Card - like the Nature Near Schools and Meaningful
Watershed Educational Experience programs - will be cut in half. We are advocating directly to the
Council to restore funding, and we hope that this Tree Report Card demonstrates just how important
environmental and outdoor education are to our students.
Acknowledgements
Casey Trees would like to thank the following partners for making
trees a priority by planting, caring for and protecting them as well
as sharing information used in this report.
District of Columbia
Department of Energy and the Environment
Department of Parks and Recreation
Department of Transportation: Urban Forestry Division
District Department of General Services
Office of the Chief Techonology Officer
Office of the Mayor
Office of Planning
Office of Zoning
Federal
USDA Forest Service
General Services Administration
National Park Service
Universities
American University
The Catholic University of America
Gallaudet University
Georgetown University
George Washington University
Howard University
University of DC
Local and Regional
11th Street Bridge Project
Anacostia Coordinating Council
Anacostia Waterfront Trust
Anacostia Watershed Society
Arbor Day Foundation
Baltimore Tree Trust
Bartlett Tree Research Laboratories
Blue Drop
Building Bridges Across the River
Catholic Cemeteries of the Archdioceses of Washington